BN could possibly trend this month and have a big fall!Between Nifty and BN, BN is expected to trend more this month after looking at the Daily charts.
Either monthly position can be taken by buying the ATM / ITM / OTM PE (Not too far OTM) and then it can be hedged with the Far OTM PE short.
For instance, 51400 PE or 51,100 PE is a good bet which can be bought.
Another strategy would be to play it intraday basis with first target at 51,000.
BANKNIFTY trade ideas

[INTRADAY] #BANKNIFTY PE & CE Levels(04/11/2024)Bank Nifty is expected to open flat today. After the opening, it is likely to trade within a consolidation zone between the 51500 and 52000 levels throughout the session. A significant downside movement is expected only if Bank Nifty starts trading below the 51450 level, which could lead to a decline toward the 51050 mark. Conversely, a strong bullish rally may occur only if it breaks above the 52050 level, signaling potential upward momentum.

Bank niftyWhen the bank nifty break the 52k level at high volume it will move upto 53900, not breaks means again comes down upto 49700 high chance this is all short term only

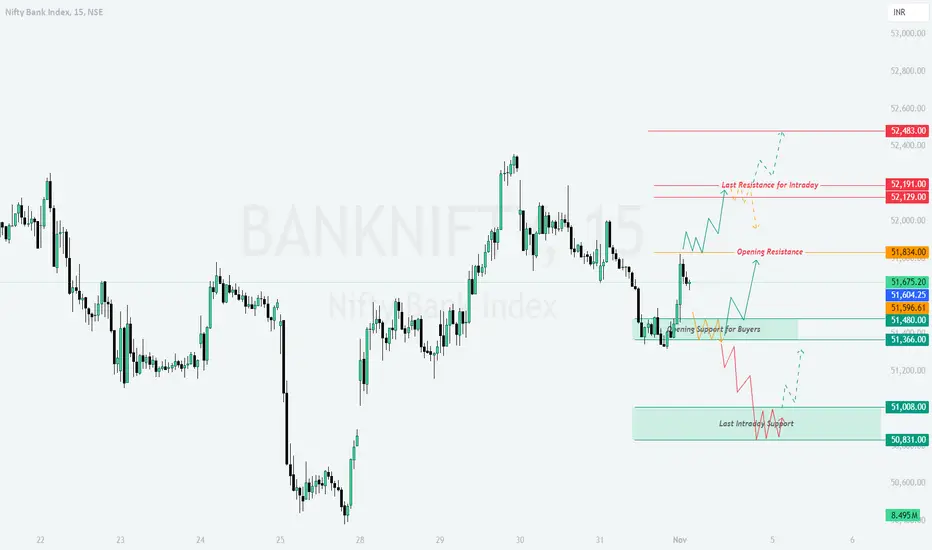
BANKNIFTY : Trading Levels and Plan for 04-Nov-2024Intro for Previous Day's Chart Pattern:
In the last two trading session, Bank Nifty displayed a mixed trend with a bounce off the support levels, suggesting buying interest from lower zones. Key resistance levels emerged near the higher range, where sellers maintained pressure. As per the chart, Yellow indicates a potential Sideways trend, Green shows a Bullish trend, and Red highlights a Bearish trend.
---
Trading Plan for 04-Nov-2024:
Opening Scenarios:
Gap Up Opening (200+ points):
If Bank Nifty opens with a significant gap up around 52,191 or higher:
- Watch for resistance near 52,191 (marked as “Last Resistance for Intraday”). A strong breakout above this level may provide momentum for further upside.
- If the price holds above 52,129, consider initiating long positions, but be cautious of quick pullbacks near 52,483, the higher resistance zone.
- If resistance holds, wait for confirmation before shorting, as the price may consolidate or pull back slightly to retest lower support levels.
Flat Opening:
If Bank Nifty opens flat around 51,675:
- Focus on the immediate resistance level of 51,834. A decisive break above this level can push prices toward the 52,000+ range.
- If prices struggle to breach 51,834, consider waiting for a dip towards 51,480, which is the “Opening Support for Buyers,” to enter long positions.
- For intraday shorts, wait for bearish confirmation near 51,834 before targeting lower levels, particularly if the price heads toward the 51,366 support area.
Gap Down Opening (200+ points):
If Bank Nifty opens with a gap down near 51,366 or lower:
- Observe the support zone around 51,366 and 51,008. If the price stabilizes in this range, it could be a good entry for long trades with a target towards 51,604.
- If 51,008 (Last Intraday Support) is breached, further downside could follow, potentially dragging the index down to the 50,831 level.
- Look for confirmation of strength or weakness before entering positions, as gap-down openings may lead to volatile price action.
---
Risk Management Tips for Options Trading:
- Use tight stop-losses in the volatile market conditions post-Diwali to avoid sharp losses.
- Avoid over-leveraging. Consider position sizing that aligns with your risk tolerance, especially near key support and resistance levels.
- Monitor option premiums closely, as high volatility can lead to rapid premium decay.
- In case of significant volatility, consider exiting options positions early to preserve gains or limit losses.
---
Summary and Conclusion:
The 04-Nov-2024 session holds potential for a continuation of recent trends, with key resistance and support levels in focus. Look for clear breakouts above resistance or signs of support holding to confirm directional bias. Sideways movement within key zones may indicate consolidation, while breaks beyond these zones may drive a more directional move.
Disclaimer: I am not a SEBI-registered analyst. This trading plan is shared for educational purposes. Please conduct your analysis or consult a financial advisor before making any trading decisions.
Banknifty seems on trend to big fall now Banknifty indicating trends on o big fall now.
Indicating in chart is the expected target.
Note: This is just an indication. Pls trade as per your risk appetite

BankNifty - Rangebound for a bit !! How's this view? I see this stuck in the range and I have my reasons here:
1. Recent Fall - There has been a significant selling from the FIIs in the last few weeks and sharp falls are visible on the chart.
The big Red candles are already implying the presence of the sellers here.
2. Long term Trend - This is still bullish and every fall is likely to be bought in such a market.
Now this alone is sufficient enough to say that the market is stuck in a range.
The view will invalidate on break of either level.

Banknifty Weekly Analysis - November 1st weekBanknifty is looking steady on charts and it can give either side momentum in the upcoming week , currently trading at 51670 bank nifty must cross 52250 for further upside momentum otherwise it can remain flat to negative in the upcoming week, 50300 will work as very important support on the downside. All levels are marked in chart posted !!!

BANK NIFTY NOVEMBER MONTH OUTLOOKBanknifty is trading within the same range since June , I'm expect range to break on either side in the upcoming month . Very important support on the downside lies on 50200 if banknifty breaks 50200 monthly basis then we can expect further downside. Otherwise if it crosses and sustains 52500 then we can expect further upside . All levels are marked in chart posted

BANKNIFTY 15 MINCurrent Market Conditions and Indicators
Market State: The market state is currently bullish, although the trend indicator is showing "Moderate" with weak strength. This suggests potential for a trend reversal or limited upward momentum.
RSI: The RSI level indicating a neutral position. It neither signals an overbought nor oversold condition, which aligns with the ranging trend.
Volatility: A moderate volatility implies some price fluctuation but not extreme, which can be suitable for more controlled short setups.
Bank nifty to follow the trend, and likely the Indian market will take queues from the global market starting first week of Nov.


BANK NIFTY S/R for 4/11/24Support and Resistance Levels:
Support Levels: These are price points (green line/shade) where a downward trend may be halted due to a concentration of buying interest. Imagine them as a safety net where buyers step in, preventing further decline.
Resistance Levels: Conversely, resistance levels (red line/shade) are where upward trends might stall due to increased selling interest. They act like a ceiling where sellers come in to push prices down.
Breakouts:
Bullish Breakout: When the price moves above resistance, it often indicates strong buying interest and the potential for a continued uptrend. Traders may view this as a signal to buy or hold.
Bearish Breakout: When the price falls below support, it can signal strong selling interest and the potential for a continued downtrend. Traders might see this as a cue to sell or avoid buying.
20 EMA (Exponential Moving Average):
Above 20 EMA(50 EMA): If the stock price is above the 20 EMA, it suggests a potential uptrend or bullish momentum.
Below 20 EMA: If the stock price is below the 20 EMA, it indicates a potential downtrend or bearish momentum.
Trendline: A trendline is a straight line drawn on a chart to represent the general direction of a data point set.
Uptrend Line: Drawn by connecting the lows in an upward trend. Indicates that the price is moving higher over time. Acts as a support level, where prices tend to bounce upward.
Downtrend Line: Drawn by connecting the highs in a downward trend. Indicates that the price is moving lower over time. It acts as a resistance level, where prices tend to drop.
RSI: RSI readings greater than the 70 level are overbought territory, and RSI readings lower than the 30 level are considered oversold territory.
Combining RSI with Support and Resistance:
Support Level: This is a price level where a stock tends to find buying interest, preventing it from falling further. If RSI is showing an oversold condition (below 30) and the price is near or at a strong support level, it could be a good buy signal.
Resistance Level: This is a price level where a stock tends to find selling interest, preventing it from rising further. If RSI is showing an overbought condition (above 70) and the price is near or at a strong resistance level, it could be a signal to sell or short the asset.
Disclaimer:
I am not a SEBI registered. The information provided here is for learning purposes only and should not be interpreted as financial advice. Consider the broader market context and consult with a qualified financial advisor before making investment decisions.

Banknifty!! Impact of global sentiments? Although last week Banknifty have shown some positivity but the weakness on Thursday confirms that this was just a trap by operators, it wasn't a profit booking as it was very deep indeed. So, bearish sentiments cont inue and my verge is you sould look for sell on rise rather buy the dip.
the trend line below have given multiple supports hence there is a huge chance that it will be broken in next move.
Safe trading

Based on one strategy trade day 3 predictionstomorrow market opens in evening with sure breakout or gap out.
the upper line describes the bull break for buy and it sustained from last 3 candles
do understand more about this average dm me.

[INTRADAY] #BANKNIFTY PE & CE Levels(31/10/2024)Today will be gap down opening in banknifty. After opening if banknifty starts trading below 51450 level then expected further downside rally of 400-500+ points. Upside rally expected above 52050 level. 51550-51950 zone is consolidated range for banknifty.

"BankNifty at a Crossroads: Key Levels to Watch Before TradeBankNifty Market Analysis
Overview:
The BankNifty index is currently at an average price level of 51,915. It sits in a consolidative zone, poised to make a directional move. With significant levels on both the upside and downside, we have clear targets if BankNifty breaks out in either direction.
Upward Direction Scenario:
If BankNifty sustains above 51,915 and momentum increases, we could see it aiming for the upward target of 53,700. This level would mark a strong upward move, suggesting bullish sentiment and potentially inviting further buying interest.
Key Levels to Watch: A breakout above intermediate resistance levels (52,500 - 53,000) would increase the likelihood of achieving this target. Monitoring volume and breakout strength is essential here.
Downward Direction Scenario:
If BankNifty fails to hold 51,915 and begins to decline, it may test the downward target of 49,700. This movement would likely reflect bearish sentiment in the market, leading to a sell-off if key support levels fail to hold.
Key Levels to Watch: A breach of immediate support zones around 50,500 - 50,000 would strengthen the downside move. Look for increasing volume as a confirmation signal.
Conclusion :
BankNifty is in a critical phase. With a clearly defined range, traders should watch for breakouts above 53,700 or breakdowns below 49,700 to determine further direction.

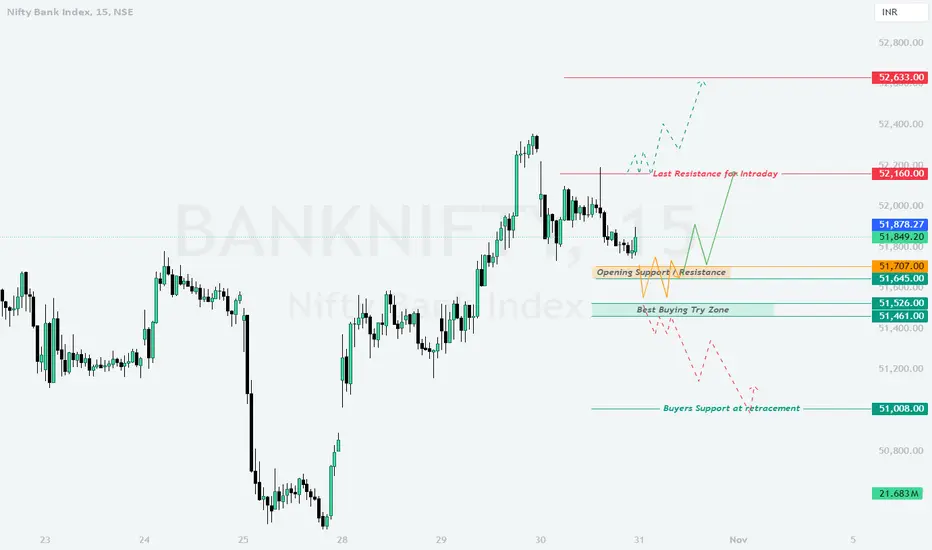
BANKNIFTY : Trading Levels and Plan for 31-10-2024
Intro:
On the previous trading day, Bank Nifty experienced a range-bound movement with significant support and resistance levels being respected. For the upcoming session on 31-Oct-2024, we have identified key levels, with yellow marking the sideways trend, green indicating bullish movement, and red representing bearish tendencies. This plan includes strategies for each opening scenario.
Trading Plan for 31-Oct-2024
Gap Up Opening (200+ points above)
If Bank Nifty opens with a 200+ point gap up, it may quickly test the Last Resistance for Intraday near 52,160 . If the price can sustain above this level, a further move towards 52,633 is likely. However, if the index fails to hold above 52,160 , it may experience a retracement to the Opening Support/Resistance level at 51,707 .
– Watch for signs of rejection at the 52,160 level, as this may prompt a reversal towards support levels.
Flat Opening (within 50 points of the previous close)
In the case of a flat opening, the immediate level to observe is 51,849 . Sustaining above this point could enable a bullish move towards 52,160 . Failure to maintain momentum above 51,849 may result in sideways movement around the Opening Support/Resistance at 51,707 or even lead to a test of the Best Buying Try Zone near 51,645 .
– A move below 51,645 would likely signal weakness, potentially driving the index lower towards 51,526 .
Gap Down Opening (200+ points below)
A gap-down opening would bring Bank Nifty closer to the Best Buying Try Zone at 51,645 . A bounce from this area could lead the index back to 51,849 . However, if this level does not hold, watch for further decline towards the Buyers Support at Retracement at 51,008 .
– Persistent weakness below 51,008 would indicate a bearish sentiment, with potential downside targets emerging.
Risk Management Tips for Options Trading
Define your risk tolerance and adjust your position size accordingly.
Consider using protective strategies, such as stop-loss orders, especially around key resistance/support zones.
Avoid over-leveraging, and monitor volatility closely to avoid sudden adverse moves.
Summary and Conclusion
Key levels for Bank Nifty on 31-Oct-2024 include 52,160 on the upside and 51,645 on the downside. Monitor these levels closely for directional cues. Employ disciplined risk management to navigate through the volatility, especially when trading options.
Disclaimer:
I am not a SEBI-registered analyst. This analysis is based on technical levels and reflects my personal view. Please perform your own analysis or consult a financial advisor before trading.
BANK NIFTY S/R for 31/10/24Support and Resistance Levels:
Support Levels: These are price points (green line/shade) where a downward trend may be halted due to a concentration of buying interest. Imagine them as a safety net where buyers step in, preventing further decline.
Resistance Levels: Conversely, resistance levels (red line/shade) are where upward trends might stall due to increased selling interest. They act like a ceiling where sellers come in to push prices down.
Breakouts:
Bullish Breakout: When the price moves above resistance, it often indicates strong buying interest and the potential for a continued uptrend. Traders may view this as a signal to buy or hold.
Bearish Breakout: When the price falls below support, it can signal strong selling interest and the potential for a continued downtrend. Traders might see this as a cue to sell or avoid buying.
20 EMA (Exponential Moving Average):
Above 20 EMA(50 EMA): If the stock price is above the 20 EMA, it suggests a potential uptrend or bullish momentum.
Below 20 EMA: If the stock price is below the 20 EMA, it indicates a potential downtrend or bearish momentum.
Trendline: A trendline is a straight line drawn on a chart to represent the general direction of a data point set.
Uptrend Line: Drawn by connecting the lows in an upward trend. Indicates that the price is moving higher over time. Acts as a support level, where prices tend to bounce upward.
Downtrend Line: Drawn by connecting the highs in a downward trend. Indicates that the price is moving lower over time. It acts as a resistance level, where prices tend to drop.
RSI: RSI readings greater than the 70 level are overbought territory, and RSI readings lower than the 30 level are considered oversold territory.
Combining RSI with Support and Resistance:
Support Level: This is a price level where a stock tends to find buying interest, preventing it from falling further. If RSI is showing an oversold condition (below 30) and the price is near or at a strong support level, it could be a good buy signal.
Resistance Level: This is a price level where a stock tends to find selling interest, preventing it from rising further. If RSI is showing an overbought condition (above 70) and the price is near or at a strong resistance level, it could be a signal to sell or short the asset.
Disclaimer:
I am not a SEBI registered. The information provided here is for learning purposes only and should not be interpreted as financial advice. Consider the broader market context and consult with a qualified financial advisor before making investment decisions.

Banknifty to reclaim 53000?As of now it looks like Banknifty have given breakout to its inverted head and shoulder pattern, and now next target can be 53200 but when? Monday? or Diwali dhamaka? on 31st?
Trade safely. Happy dipawali


Wait and Watch approach on Bank NiftyYesterdays relief rally on BN must not be interpreted as a Bullish call.
BN faces stiff resistance around 52,400 zones.
At the same time, Nifty is weaker in comparison to BN.
My understanding is that some sort of price action will need to form at these levels to understand the further direction. It could also happen that BN may correct from here.
I would advice an intraday approach on both indices for the next few days.

[INTRADAY] #BANKNIFTY PE & CE Levels(30/10/2024)Today will be flat or slightly gap up opening expected in banknifty. After opening banknifty will face immediate resistance at 52450 level. After breakout of this level if banknifty starts trading above 52550 level then possible strong upside rally of 400-500+ points upto 52950 level. Any major downside only expected if it's starts trading below 50950 level.

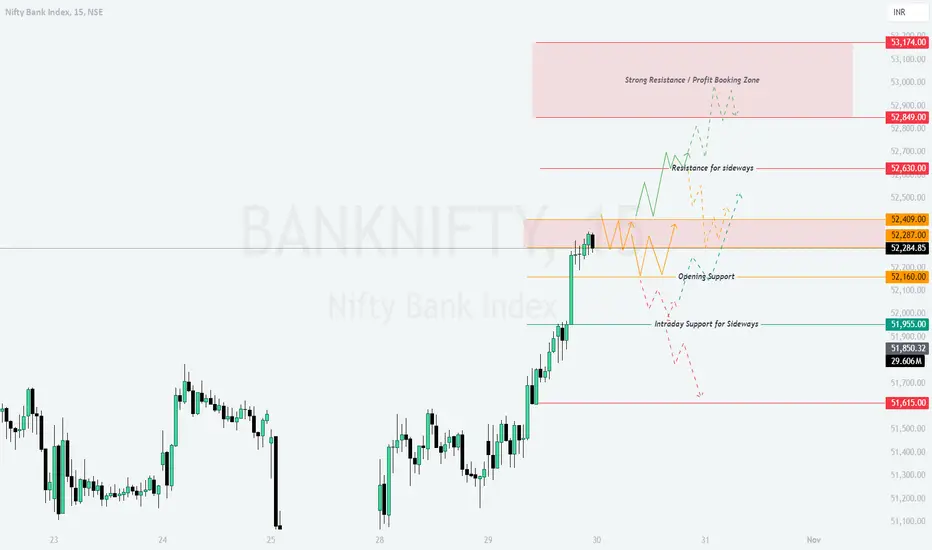
BANKNIFTY : Trading Levels and Plan for 30-Oct-2024
Intro:
On the previous trading day, Bank Nifty exhibited strong upward momentum and achieving all the targets that mentioned in yesterday's Trading plan, testing new resistance levels with limited retracements. Key zones have emerged for tomorrow, with a mix of potential sideways, bullish, and bearish trends. The chart highlights yellow as the trend indicating sideways movement, green for bullish trends, and red for bearish trends. Here’s a trading strategy based on different opening scenarios.
Trading Plan for 30-Oct-2024
Gap Up Opening (200+ points above)
If Bank Nifty opens with a 200+ points gap up, it is likely to encounter resistance near the 52,849 level, marked as the Resistance for Sideways . If prices sustain above this level, we could see an upward movement towards the Strong Resistance / Profit Booking Zone at 53,174 . However, if it fails to maintain above 52,849 , expect a retracement towards 52,409 or even back to the Opening Support level at 52,160 .
– If selling pressure increases at these levels, there is a possibility of the index dropping towards the Intraday Support for Sideways at 51,955 .
Flat Opening (within 100 points of the previous close)
With a flat opening, focus on the early price action near 52,287 . A move above 52,409 could trigger a bullish run toward 52,849 . Watch for consolidation or resistance in this zone; if it breaks above, the next target could be 53,174 . Alternatively, failure to hold above 52,409 could lead to a test of 52,160 (Opening Support) and possibly a downward trend toward 51,955 .
– A breakdown below 51,955 may signal additional selling pressure, testing levels as low as 51,615 .
Gap Down Opening (200+ points below)
In a gap-down scenario, Bank Nifty will likely find immediate support at 51,955 . If it holds, there may be a bounce back toward 52,287 to regain momentum. A strong recovery above 52,287 could shift the sentiment back to bullish, aiming for 52,849 as the next resistance level. However, if 51,955 fails as support, expect further declines toward 51,615 .
– Any sustained weakness below 51,615 could accelerate bearish trends and lead to more downside.
Risk Management Tips for Options Trading
Position sizing is crucial in options trading; avoid over-leveraging on volatile days.
Utilize trailing stop-loss orders to lock in profits on favorable trades, especially if volatility increases near key resistance/support levels.
Consider the use of spreads to minimize risks and protect against sharp directional moves.
Summary and Conclusion
For 30-Oct-2024, the focus remains on 52,849 as a major resistance level and 51,955 as a critical support. Trading with a flexible mindset and adhering to defined stop-losses can help manage risks efficiently. Keeping an eye on early price action can provide direction for the rest of the day.
Disclaimer:
I am not a SEBI-registered analyst. The above analysis is based on technical levels and reflects my personal perspective. Always conduct your own analysis or consult a financial advisor before making any trading decisions.
BANK NIFTY S/R for 30/10/24Support and Resistance Levels:
Support Levels: These are price points (green line/shade) where a downward trend may be halted due to a concentration of buying interest. Imagine them as a safety net where buyers step in, preventing further decline.
Resistance Levels: Conversely, resistance levels (red line/shade) are where upward trends might stall due to increased selling interest. They act like a ceiling where sellers come in to push prices down.
Breakouts:
Bullish Breakout: When the price moves above resistance, it often indicates strong buying interest and the potential for a continued uptrend. Traders may view this as a signal to buy or hold.
Bearish Breakout: When the price falls below support, it can signal strong selling interest and the potential for a continued downtrend. Traders might see this as a cue to sell or avoid buying.
20 EMA (Exponential Moving Average):
Above 20 EMA(50 EMA): If the stock price is above the 20 EMA, it suggests a potential uptrend or bullish momentum.
Below 20 EMA: If the stock price is below the 20 EMA, it indicates a potential downtrend or bearish momentum.
Trendline: A trendline is a straight line drawn on a chart to represent the general direction of a data point set.
Uptrend Line: Drawn by connecting the lows in an upward trend. Indicates that the price is moving higher over time. Acts as a support level, where prices tend to bounce upward.
Downtrend Line: Drawn by connecting the highs in a downward trend. Indicates that the price is moving lower over time. It acts as a resistance level, where prices tend to drop.
RSI: RSI readings greater than the 70 level are overbought territory, and RSI readings lower than the 30 level are considered oversold territory.
Combining RSI with Support and Resistance:
Support Level: This is a price level where a stock tends to find buying interest, preventing it from falling further. If RSI is showing an oversold condition (below 30) and the price is near or at a strong support level, it could be a good buy signal.
Resistance Level: This is a price level where a stock tends to find selling interest, preventing it from rising further. If RSI is showing an overbought condition (above 70) and the price is near or at a strong resistance level, it could be a signal to sell or short the asset.
Disclaimer:
I am not a SEBI registered. The information provided here is for learning purposes only and should not be interpreted as financial advice. Consider the broader market context and consult with a qualified financial advisor before making investment decisions.
