BankNifty Crashes Through All Targets – Bears in Control!BankNifty 15m Timeframe Technical Analysis:
On the 15-minute timeframe, BankNifty has completed a spectacular short trade, smashing through all targets with strong bearish momentum. Price plunged well below the Risological dotted trendline, confirming the continued downtrend.
Key Levels:
Entry: 51,620.00
Stop Loss (SL): 51,700.75
Target 1 (TP1): 51,520.15 (Done)
Target 2 (TP2): 51,358.60 (Done)
Target 3 (TP3): 51,197.05 (Done)
Target 4 (TP4): 51,097.20 (Done)
Observations:
A sharp decline occurred right after entry, and price respected the Risological dotted trendline as resistance throughout the trade.
Bears dominated the session, pushing the price lower without retracing back to the trendline.
BankNifty's steep descent through all target levels underscores the market's bearish sentiment. With all targets achieved, traders may look for further downside potential or await signs of reversal.
BANKNIFTY trade ideas

[INTRADAY] #BANKNIFTY PE & CE Levels(25/10/2024)Today will be flat opening expected in banknifty. After opening if banknifty starts trading below 51450 level then downside rally of 400-500 points expected. Downside 51050 level will act as an important support for today's session. Any upside rally only expected if banknifty sustain above 51550 level.

Bank Nifty LevelsBank Nifty is forming a Head and shoulder and a expanding channel within it possible break down and level both upside and downside

BANKNIFTY KEY LEVELS FOR 25/10/2024//@description
// All credit goes to Tony for the concept of this indicator. His Trading View link: www.tradingview.com
// Note: The calculation method in this indicator differs from Tony's, but the concept is derived from his work.
**Explanation:**
This trading system helps you avoid blind trades by providing confirmation for better entries and exits. It considers volume, past prices, price range and indiavix.
**Entry/Exit Points:**
- **Entry/Exit Lines:** Use the BLACK line for long trades and the RED line for short trades, based on confirmation from your trading plan.
- **Stop Loss:** For long trades, set the stop loss at the RED line below. For short trades, set it at the BLACK line above.
- **Take Profit:** For long trades, target the next RED line above. For short trades, target the next BLACK line below.
**Timeframe:**
Use a 5 timeframe for trading.
**Risk Disclaimer:**
This setup is for educational purposes. I'm not responsible for your gains or losses. Check the chart for more details.

BANK NIFTY S/R for 25/10/24Support and Resistance Levels:
Support Levels: These are price points (green line/shade) where a downward trend may be halted due to a concentration of buying interest. Imagine them as a safety net where buyers step in, preventing further decline.
Resistance Levels: Conversely, resistance levels (red line/shade) are where upward trends might stall due to increased selling interest. They act like a ceiling where sellers come in to push prices down.
Breakouts:
Bullish Breakout: When the price moves above resistance, it often indicates strong buying interest and the potential for a continued uptrend. Traders may view this as a signal to buy or hold.
Bearish Breakout: When the price falls below support, it can signal strong selling interest and the potential for a continued downtrend. Traders might see this as a cue to sell or avoid buying.
20 EMA (Exponential Moving Average):
Above 20 EMA(50 EMA): If the stock price is above the 20 EMA, it suggests a potential uptrend or bullish momentum.
Below 20 EMA: If the stock price is below the 20 EMA, it indicates a potential downtrend or bearish momentum.
Trendline: A trendline is a straight line drawn on a chart to represent the general direction of a data point set.
Uptrend Line: Drawn by connecting the lows in an upward trend. Indicates that the price is moving higher over time. Acts as a support level, where prices tend to bounce upward.
Downtrend Line: Drawn by connecting the highs in a downward trend. Indicates that the price is moving lower over time. It acts as a resistance level, where prices tend to drop.
RSI: RSI readings greater than the 70 level are overbought territory, and RSI readings lower than the 30 level are considered oversold territory.
Combining RSI with Support and Resistance:
Support Level: This is a price level where a stock tends to find buying interest, preventing it from falling further. If RSI is showing an oversold condition (below 30) and the price is near or at a strong support level, it could be a good buy signal.
Resistance Level: This is a price level where a stock tends to find selling interest, preventing it from rising further. If RSI is showing an overbought condition (above 70) and the price is near or at a strong resistance level, it could be a signal to sell or short the asset.

BANKNIFTY : Trading Stratgies and Levels for 25-Oct-2024Introduction:
In the previous session on 24th October 2024, Bank Nifty displayed volatile price action, attempting to recover from its intraday low. Key support levels, such as 51,385, held the index from further downside, while resistance near 51,840 remained unbroken. A clear directional move is awaited as the index shows signs of potential retracement and consolidation around the crucial support zones. With 25th October 2024 being an important trading day, we’ll analyze possible market openings and provide a structured trading plan for each scenario.
---
Trading Plan for 25th October 2024:
Gap Up Opening (200+ points):
If Bank Nifty opens with a gap up above 51,700:
⠀⠀- Watch for price action near the Resistance for Trend Reversal at 51,840. A reversal could happen at this level, so wait for confirmation before considering short trades.
⠀⠀- If Bank Nifty breaks above 52,260, it could lead to an upward trend extension. However, caution is advised, as profit booking is expected around this zone.
⠀⠀- Expect retracement back to the Opening Support level of 51,446 if the price fails to hold above 51,840.
⠀⠀- Look for selling opportunities near resistance, with a target towards 51,385, ensuring proper stop losses to manage risk.
Flat Opening:
If Bank Nifty opens around the previous close (51,565):
⠀⠀- The initial move should be towards the Opening Support / Resistance at 51,446. Watch for either a bounce or breakdown from this level to determine the market direction.
⠀⠀- A breakdown below 51,446 could send Bank Nifty towards the Buyer's Support at Retracement near 51,247.
⠀⠀- Upside potential remains intact if 51,446 holds. The immediate target on the upside will be 51,840. If this level is broken, watch for the 52,260 zone to act as the final resistance before a trend reversal.
⠀⠀- For flat openings, entering with small position sizes and using trailing stop losses can help capture potential swings.
Gap Down Opening (200+ points):
If Bank Nifty opens with a gap down near or below 51,300:
⠀⠀- The key level to watch will be the Buyer's Support at Retracement at 51,247. If this support holds, expect a quick bounce back to 51,446.
⠀⠀- A breach of 51,247 will expose Bank Nifty to further downside risk, targeting the Support for Sideways zone near 50,864 and potentially 50,701.
⠀⠀- Keep tight stop losses if trading during a gap-down scenario, as the volatility may trigger sharp moves. Wait for consolidation or clear price action before entering long positions, especially if support levels break.
⠀⠀- Short trades could be initiated if price sustains below 51,247, with a downside target towards 50,864.
---
Risk Management Tips for Options Trading:
Focus on spread strategies , such as Iron Condors or Butterfly spreads, to manage volatility and risk in uncertain market conditions.
Use tight stop losses when trading naked options, especially during gap scenarios, as premiums can spike quickly, leading to large losses if positions are left unmanaged.
Avoid aggressive entries immediately after large gap openings. Let the market stabilize for the first 30 minutes before executing trades.
For positional traders, look for opportunities to buy options closer to support and sell near resistance to maximize risk/reward potential.
---
Summary & Conclusion:
For the session on 25th October 2024, Bank Nifty will likely face critical tests at the 51,840 and 51,247 levels, with either leading to key moves depending on market reaction. Traders should remain cautious during gap scenarios and wait for confirmation from price action to avoid getting trapped in volatile movements. Keeping risk management at the forefront, particularly in options trading, will be essential to navigate the day successfully.
Disclaimer:
I am not a SEBI-registered analyst. The levels and strategies provided here are based on personal analysis and should not be considered as financial advice. Please do your own research or consult a financial advisor before making trading decisions.

[INTRADAY] #BANKNIFTY PE & CE Levels(24/10/2024)Today will be flat or slightly gap up opening expected in banknifty. 51050-51450 zone is consolidation area for banknifty. Upside bullish rally expected if banknifty gives breakout and sustain above 51550 level in today's session. Strong downside expected below 50950 level in today's session.

Banknifty Market View
Bank Nifty Technical Analysis (15-Minute Timeframe):
Current Trend:
The Bank Nifty index is exhibiting a bullish structure on the 15-minute chart, indicating upward momentum. However, signs suggest the potential for a short-term corrective move or consolidation, hinting at a temporary reversal to the upside. Despite the bullish momentum in the shorter timeframe, the broader trend remains inclined towards a downtrend.
Key Reversal Level:
51260 acts as the pivotal level for trend shifts.
Bullish Scenario:
If Bank Nifty breaks and sustains above 51260, it signals the initiation of a potential upward rally.
Upside Target Range: 51600 to 51800
Bearish Scenario:
A break below 51260 may trigger a downward continuation aligned with the longer-term trend.
Downside Target Range: 50500 to 50250
This analysis highlights the importance of the 51260 level as the critical juncture for the next directional move. Traders should watch for price action near this point to confirm breakout or breakdown scenarios.

BANKNIFTY : Trading Levels and Plan for 24-Oct-2024Bank Nifty Trading Plan for 24th October 2024
In the previous session, Bank Nifty traded in a volatile range between 51,305 resistance and 51,200 support, forming a consolidation zone. Buyers showed interest at lower levels but failed to push beyond key resistances. This pattern suggests that a breakout or breakdown could occur soon, and traders should closely monitor key levels on 24th October to capitalize on the potential movement.
Gap-Up Opening (200+ Points):
If Bank Nifty opens above 51,786, wait for a confirmed breakout and sustained price action. A strong move above this level could lead to further gains toward the Choch resistance zone at 52,363.
For long positions, target 52,363, where sellers might step in, and set a stop-loss below 51,786 to protect against a false breakout.
In case of a reversal after the initial gap-up, expect a pullback toward 51,382. If price action breaks below 51,382, it could re-enter the consolidation zone.
Monitor price behavior near the 51,786 resistance zone, as a failure to hold above may lead to increased volatility and a test of lower supports.
Flat Opening:
If the market opens flat near 51,305, focus on the immediate range between 51,382 (upside resistance) and 51,124 (downside support).
A breakout above 51,382 may trigger a move toward the next resistance level of 51,786, while a breakdown below 51,124 could lead to a bearish trend toward 50,817.
For long positions, use 51,124 as the risk level and target 51,786. For short trades, a breakdown below 51,124 should have a target of 50,817 with a stop-loss above 51,305.
Be cautious of choppy price action within the "No Trade Zone" (51,305 - 51,124), as this area may see reduced volatility and indecision.
Gap-Down Opening (200+ Points):
If Bank Nifty opens below 51,124, expect selling pressure to increase, with immediate downside targets at 50,817 and 50,705.
If the price holds above 50,817, a reversal trade might be considered for long positions, but ensure confirmation before entering. A bounce above 50,817 could lead to a retest of 51,124.
A break below 50,705 could result in further declines toward 50,517, where buyers may attempt to regain control.
Keep a stop-loss below 50,817 for longs, and manage short trades with a stop above 51,124 in case of sharp reversals.
Risk Management Tips for Options Trading:
In a gap-up scenario, consider using call spreads as Bank Nifty approaches key resistance zones like 51,786 and 52,363 to limit risk and capture upside potential.
In case of a gap-down, put spreads or long puts could be effective strategies to benefit from increased volatility and downside movement.
Avoid naked positions, especially near high-volatility zones, as sudden reversals can erode premium values quickly. Opt for safer strategies like vertical spreads or iron condors to limit exposure.
Set defined stop-losses and stick to your trading plan, especially if Bank Nifty approaches key support or resistance levels, as these areas are prone to sharp movements.
Summary & Conclusion:
For 24th October 2024, Bank Nifty’s key levels to watch are the resistance at 51,786 and support at 51,124. A gap-up could test 52,363, while a gap-down may lead to 50,705. Volatility is expected around these levels, and maintaining strict stop-losses is crucial to managing risk effectively. In options trading, using spreads or defined-risk strategies is advisable to navigate high volatility and sudden price reversals.
Disclaimer: I am not a SEBI registered analyst. This trading plan is based on my personal analysis using technical parameters. Traders are advised to conduct their own research or consult with a financial advisor before making any trading decisions.

BankNifty 24-OCT-2024 Intraday Levels, Sell Trend in BankNifty BankNifty tried to go upside and respected that resistance level which we identified yesterday as per the price movement.
It reversed, and keep trading near bottom level.
BankNifty took pause today in daily time frame and can continue tomorrow and become trending.
We can sell when 5 min candle close below 51150 price.
Note : Its just an analysis, wait for the price to confirm.
Disclaimer : Always follow risk to reward, this is the only key to success in market, no matter how much good a trade is looking we never know the future.

BANK NIFTY S/R for 24/10/24Support and Resistance Levels:
Support Levels: These are price points (green line/shade) where a downward trend may be halted due to a concentration of buying interest. Imagine them as a safety net where buyers step in, preventing further decline.
Resistance Levels: Conversely, resistance levels (red line/shade) are where upward trends might stall due to increased selling interest. They act like a ceiling where sellers come in to push prices down.
Breakouts:
Bullish Breakout: When the price moves above resistance, it often indicates strong buying interest and the potential for a continued uptrend. Traders may view this as a signal to buy or hold.
Bearish Breakout: When the price falls below support, it can signal strong selling interest and the potential for a continued downtrend. Traders might see this as a cue to sell or avoid buying.
20 EMA (Exponential Moving Average):
Above 20 EMA(50 EMA): If the stock price is above the 20 EMA, it suggests a potential uptrend or bullish momentum.
Below 20 EMA: If the stock price is below the 20 EMA, it indicates a potential downtrend or bearish momentum.
Trendline: A trendline is a straight line drawn on a chart to represent the general direction of a data point set.
Uptrend Line: Drawn by connecting the lows in an upward trend. Indicates that the price is moving higher over time. Acts as a support level, where prices tend to bounce upward.
Downtrend Line: Drawn by connecting the highs in a downward trend. Indicates that the price is moving lower over time. It acts as a resistance level, where prices tend to drop.
RSI: RSI readings greater than the 70 level are overbought territory, and RSI readings lower than the 30 level are considered oversold territory.
Combining RSI with Support and Resistance:
Support Level: This is a price level where a stock tends to find buying interest, preventing it from falling further. If RSI is showing an oversold condition (below 30) and the price is near or at a strong support level, it could be a good buy signal.
Resistance Level: This is a price level where a stock tends to find selling interest, preventing it from rising further. If RSI is showing an overbought condition (above 70) and the price is near or at a strong resistance level, it could be a signal to sell or short the asset.

BANKNIFTY to 48300 in 2024?This chart on the Bank Nifty 2-hour timeframe tells a story of critical support and resistance levels. After breaking down from the rising channel and falling below the 50-period SMA, the index has shown weakness, retesting the channel and getting rejected near key moving averages. Bullish sentiment remains in check, with potential recovery only if the price can break above 51,600, which aligns with the 20-period and 50-period SMAs, as well as the 0.236 Fibonacci retracement level. However, as of now, the rejection suggests downside risk.
The immediate support stands around 51,212, with a potential downside to 50,194 and even further into the 48,900 zone if the selling pressure persists. A clear bear flag formation on the higher timeframes adds weight to the bearish outlook.
Traders should watch these levels closely, with 51,600 being the crucial point for a bullish reversal. The current market structure indicates a probable correction phase unless bulls regain control above that resistance level. Keep a close eye on volume spikes for confirmation!

Nifty & Bank Nifty Analysis and Trade Plan for 24th OctoberNifty & Bank Nifty Analysis and Trade Plan for 24th October

[INTRADAY] #BANKNIFTY PE & CE Levels(23/10/2024)Today will be gap down opening expected in banknifty. Expected opening near 51050 level. After opening if banknifty starts trading below 50950 level then expected strong downside rally of 400-500 points in index. Any bullish side movement only expected if it's sustain above 51050 level. Upside 51450 will act as an immediate resistance for banknifty.

Inverse Pole and Flag in Nifty BankNifty Bank has fallen from the parallel channel upper trendline, giving a slight breakout. If the downside movement continues, it opens up a pole-and-flag pattern target.
Trade in small quantities.
Trade with stop loss.
Risk Management and Money Management are more important than setups.
For Paper Trading and Educational Purposes only.

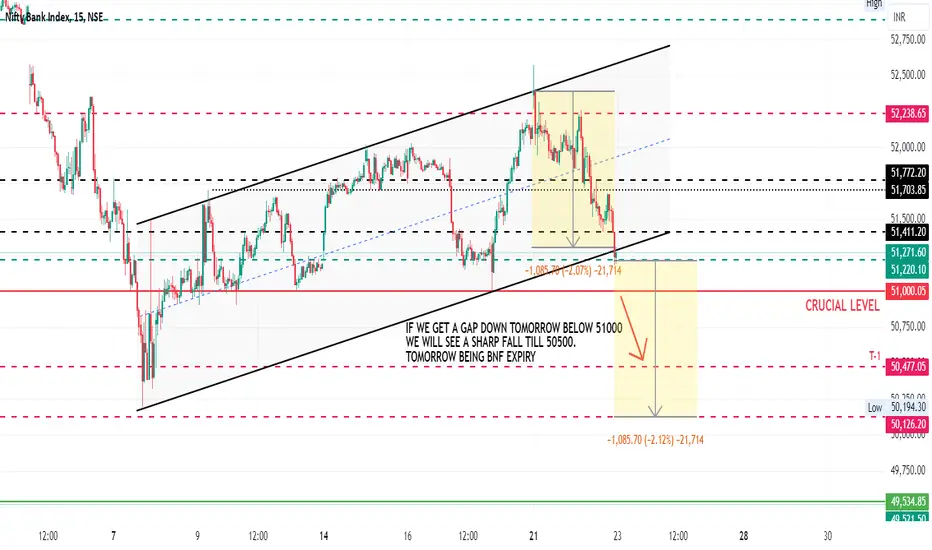
Decisive Day?This expiry can be decisive for sure , all moving avrages on aggresive sell out - broke an important support in the last 30 min, it will be make or break for sure-- put your bets cause it will be money print expiry for sure ---

BANKNIFTY : Trading levels and Plan for 23-Oct-2024Bank Nifty Trading Plan for 23rd October 2024
In the previous session, Bank Nifty experienced a volatile session, testing key resistance near 52,250 Prices declined drastically as mentioned in yesterday's trading plan. This range highlights a crucial “No Trade Zone” where price consolidation has been observed. As the market prepares for the 23rd October session, it's important to focus on key levels such as 51,786 for trend change and 50,817 as buyer’s support, as these areas will determine the next major move.
Gap-Up Opening (200+ Points):
If Bank Nifty opens above the resistance zone of 51,786, look for price action confirmation before entering a long trade.
A breakout above 51,786 may lead to a rally towards the 52,363 zone, but keep in mind that this is a significant resistance area. Any rejection here could lead to a quick retracement.
Place a stop-loss just below 51,786 to manage risk and prevent getting trapped in a false breakout.
If Bank Nifty fails to hold above 51,786 after a gap-up, expect a reversal back into the “No Trade Zone” near 51,382, where price may consolidate.
Flat Opening:
A flat opening near the 51,271 level suggests consolidation in the "No Trade Zone" between 51,382 and 51,124. Avoid taking trades unless there’s a clear breakout or breakdown from this zone.
If Bank Nifty breaks above 51,382, watch for momentum to push prices towards 51,786. A sustained move above 51,786 can signal trend continuation to the upside.
If the index breaks below 51,124, it opens up downside potential towards 50,817, where buyers might step in to defend.
Maintain a stop-loss below 51,124 for long positions and above 51,382 for shorts to manage risk in this consolidation area.
Gap-Down Opening (200+ Points):
If Bank Nifty opens with a gap-down below the 51,124 level, selling pressure may intensify towards the support level at 50,817.
A bounce from 50,817 could present an opportunity for a long trade, but wait for a clear reversal signal to avoid getting caught in further downside.
If Bank Nifty breaks below 50,817, the next support is at 50,517, which is a crucial level for bulls to defend. Failure to hold this level may result in further selling towards 50,000.
Place a stop-loss below 50,817 for any long trades and consider shorting if this level is breached.
Risk Management Tips for Options Trading:
For gap-up scenarios, use call spreads to limit risk as Bank Nifty approaches resistance zones like 51,786 and 52,363.
In case of a gap-down, consider buying put options or using put spreads to capitalize on increased volatility towards support levels like 50,817 and 50,517.
Avoid trading naked options positions, especially near key support/resistance zones, as rapid moves in either direction could lead to significant losses.
Use stop-losses diligently when trading options, and consider using straddles or strangles in high-volatility conditions to capture both sides of the market.
Summary & Conclusion:
For 23rd October 2024, the critical levels to watch are the resistance at 51,786 and support at 50,817. A gap-up may lead to a test of 52,363, while a gap-down could bring Bank Nifty towards 50,517. Be cautious within the “No Trade Zone” (51,382 - 51,124) as price may consolidate here before the next major move. In options trading, use spread strategies to manage risk and capture gains during volatile conditions.
Disclaimer: I am not a SEBI registered analyst. This trading plan is based on my personal analysis using technical parameters. Traders are advised to conduct their own research or consult with a financial advisor before making any trading decisions.

BANKNIFTY Short Entry – BIG Targets Await!We’ve entered a short trade on BANKNIFTY based on a clear bearish signal at 51733.25. The setup looks strong, and we're now awaiting the targets to hit.
Key Levels
Entry: 51733.25 – Initiated as bearish momentum took hold.
Stop-Loss (SL): 52155.40 – Positioned above the entry to manage risk.
Take Profit 1 (TP1): 51211.50 – First target expected to be reached soon.
Take Profit 2 (TP2): 50367.25 – Next key level to watch.
Take Profit 3 (TP3): 49523.00 – Anticipating continued selling pressure to hit this target.
Take Profit 4 (TP4): 49001.25 – The ultimate target in this short trade.
Trend Analysis
The price is moving decisively below the Risological Dotted Trendline, confirming a strong downtrend. All indicators suggest that the targets are within reach as selling pressure builds.
This is going to be a high profit trade if it works out as per the chart. But, let's be ready for rude surprises and have the trailing stop at 51,748 in worst case scenario.

Bank Nifty on WeeklyBank nifty in weekly Time frame is looking in between this channel plus this evening star kind of pattern...

BANKNIFTY KEY LEVELS FOR 23/10/2024//@description
// All credit goes to Tony for the concept of this indicator. His Trading View link: www.tradingview.com
// Note: The calculation method in this indicator differs from Tony's, but the concept is derived from his work.
**Explanation:**
This trading system helps you avoid blind trades by providing confirmation for better entries and exits. It considers volume, past prices, price range and indiavix.
**Entry/Exit Points:**
- **Entry/Exit Lines:** Use the BLACK line for long trades and the RED line for short trades, based on confirmation from your trading plan.
- **Stop Loss:** For long trades, set the stop loss at the RED line below. For short trades, set it at the BLACK line above.
- **Take Profit:** For long trades, target the next RED line above. For short trades, target the next BLACK line below.
**Timeframe:**
Use a 5 timeframe for trading.
**Risk Disclaimer:**
This setup is for educational purposes. I'm not responsible for your gains or losses. Check the chart for more details.

Bank nifty Analysis for Tomorrow 23/10/24Bank nifty Analysis for Tomorrow 23/10/24
Here are the Levels for Bank nifty Using Trendlines, technical analysis or Fib level
For Options Traders(Specially Buyers)
My humble Request with you pls Do trade After 2pm for less Brokerage and Taxes and More Profit.
To Become a Profitable Option Buyer pls Come For trade after 2 pm.

BANK NIFTY S/R for 23/10/24Support and Resistance Levels:
Support Levels: These are price points (green line/shade) where a downward trend may be halted due to a concentration of buying interest. Imagine them as a safety net where buyers step in, preventing further decline.
Resistance Levels: Conversely, resistance levels (red line/shade) are where upward trends might stall due to increased selling interest. They act like a ceiling where sellers come in to push prices down.
Breakouts:
Bullish Breakout: When the price moves above resistance, it often indicates strong buying interest and the potential for a continued uptrend. Traders may view this as a signal to buy or hold.
Bearish Breakout: When the price falls below support, it can signal strong selling interest and the potential for a continued downtrend. Traders might see this as a cue to sell or avoid buying.
20 EMA (Exponential Moving Average):
Above 20 EMA(50 EMA): If the stock price is above the 20 EMA, it suggests a potential uptrend or bullish momentum.
Below 20 EMA: If the stock price is below the 20 EMA, it indicates a potential downtrend or bearish momentum.
Trendline: A trendline is a straight line drawn on a chart to represent the general direction of a data point set.
Uptrend Line: Drawn by connecting the lows in an upward trend. Indicates that the price is moving higher over time. Acts as a support level, where prices tend to bounce upward.
Downtrend Line: Drawn by connecting the highs in a downward trend. Indicates that the price is moving lower over time. It acts as a resistance level, where prices tend to drop.
RSI: RSI readings greater than the 70 level are overbought territory, and RSI readings lower than the 30 level are considered oversold territory.
Combining RSI with Support and Resistance:
Support Level: This is a price level where a stock tends to find buying interest, preventing it from falling further. If RSI is showing an oversold condition (below 30) and the price is near or at a strong support level, it could be a good buy signal.
Resistance Level: This is a price level where a stock tends to find selling interest, preventing it from rising further. If RSI is showing an overbought condition (above 70) and the price is near or at a strong resistance level, it could be a signal to sell or short the asset.
Disclaimer:
I am not a SEBI registered. The information provided here is for learning purposes only and should not be interpreted as financial advice. Consider the broader market context and consult with a qualified financial advisor before making investment decisions.