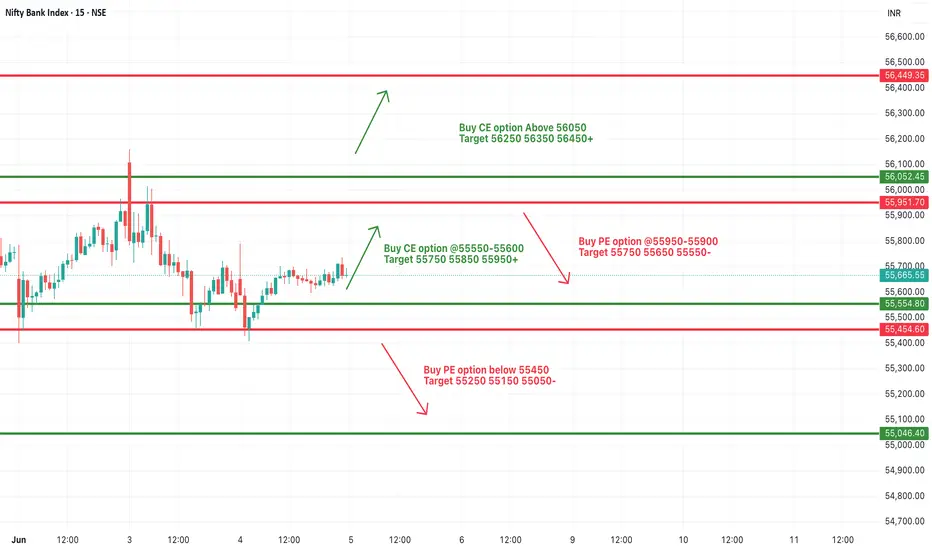
[INTRADAY] #BANKNIFTY PE & CE Levels(05/06/2025)Bank Nifty is opening slightly gap-up around the 55650–55700 zone, hinting at a cautious positive bias. However, the index remains within a well-defined range, and today’s session could act as a trigger for the next directional move.
If Bank Nifty sustains above 55600, bullish momentum may build toward 55750, 55850, and 55950+. A breakout above 56050 could further accelerate the upside, potentially targeting 56250 and beyond.
However, if the index fails to hold above 55700 and starts reversing, a pullback toward 55600 and 55500 is possible.
A breakdown below 55450 would signal weakness and open up downside levels toward 55250, 55150, and 55050, where stronger support is expected.
BANKNIFTY trade ideas
Bank Nifty bullishBNF 55675 is still in bullish trend on daily charts.
Fii's have sold 305 contracts.
Resistance at 55900. We expect BNF will test the resistance before dropping to support 54820

BankNifty levels - Jun 05, 2025Utilizing the support and resistance levels of BankNifty, along with the 5-minute timeframe candlesticks and VWAP, can enhance the precision of trade entries and exits on or near these levels. It is crucial to recognize that these levels are not static, and they undergo alterations as market dynamics evolve.
The dashed lines on the chart indicate the reaction levels, serving as additional points of significance. Furthermore, take note of the response at the levels of the High, Low, and Close values from the day prior.
We trust that this information proves valuable to you.
* If you found the idea appealing, kindly tap the Boost icon located below the chart. We encourage you to share your thoughts and comments regarding it.
Wishing you successful trading endeavors!

BANKNIFTY Daily Analysis📈 BANKNIFTY Daily Analysis – June 4, 2025
Current Price: ₹55,616.80
Change: +₹16.85 (+0.03%)
---
🔍 Technical Outlook:
Rising Wedge Structure: Price is moving within a narrowing ascending channel — typically a bearish reversal pattern if broken.
Resistance Zone: Strong rejection seen near ₹56,161, suggesting supply pressure at highs.
PE Target Identified: ₹53,483 may act as the first target in case of short-term correction.
Imbalance Zone (Gap Area): Left behind from April rally; price may revisit this area to fill the inefficiency.
🧭 Potential Scenarios:
1. Short-Term Pullback: A dip toward the ₹53,483 PE target is possible.
2. Bounce Opportunity: Watch for a bullish reversal from either the PE target or the Potential Buy Zone at ₹52,000–₹52,500.
3. Bullish Continuation: If price holds above the channel, breakout above ₹56,161 could lead to a new rally.
---
📌 Key Levels to Watch:
Resistance: ₹56,161
Support: ₹53,483 → ₹52,000 (Buy Zone)
Imbalance Area: Could attract price magnetically
💡 Trading Idea:
Consider put options or short-term shorts toward ₹53,483.
Re-evaluate long positions near ₹52K zone with confirmation.

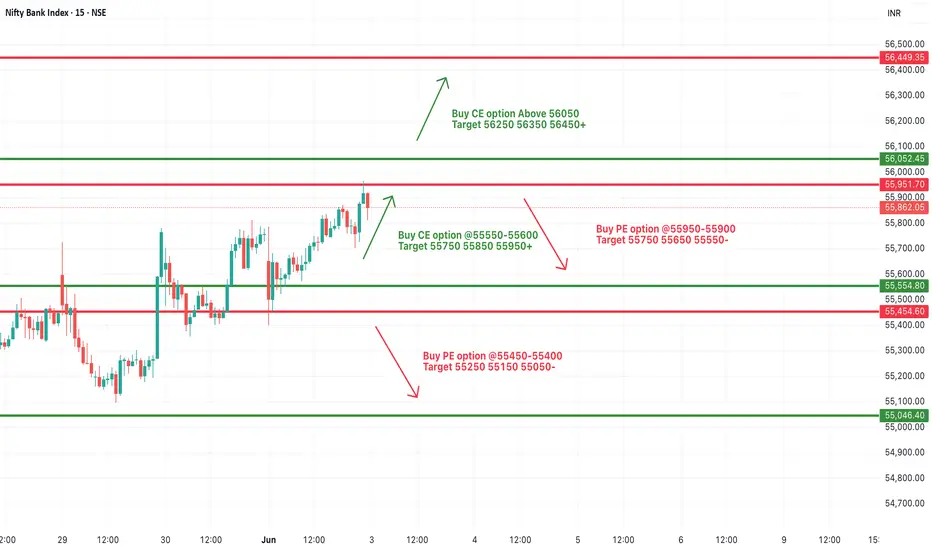
[INTRADAY] #BANKNIFTY PE & CE Levels(04/06/2025)Bank Nifty is expected to open with a gap-up near the 55950 level, which places it at a critical resistance zone. If it sustains above this level, it may extend the bullish momentum toward 55750, 55850, and 55950+, but more importantly, a breakout above 56050 would trigger a fresh upside rally with targets at 56250, 56350, and 56450+.
However, if Bank Nifty fails to hold above 55900–55950 and reverses below this zone, a short trade setup may activate, with potential downside targets of 55750, 55650, and 55550.
Further weakness can be confirmed only if the index slips below the 55550–55600 support zone, exposing it to 55250, 55150, and 55050 levels.

BankNifty levels - Jun 04, 2025Utilizing the support and resistance levels of BankNifty, along with the 5-minute timeframe candlesticks and VWAP, can enhance the precision of trade entries and exits on or near these levels. It is crucial to recognize that these levels are not static, and they undergo alterations as market dynamics evolve.
The dashed lines on the chart indicate the reaction levels, serving as additional points of significance. Furthermore, take note of the response at the levels of the High, Low, and Close values from the day prior.
We trust that this information proves valuable to you.
* If you found the idea appealing, kindly tap the Boost icon located below the chart. We encourage you to share your thoughts and comments regarding it.
Wishing you successful trading endeavors!

Let's Try to Find Banknifty Crucial Support ZoneToday Bank nifty made lifetime High 56161 but failed to give conviction Breakout, No Doubt Price action is very good also Support near 20 EMA on hourly or Daily chart with making a bullish ascending tringle Pattern But any pattern to validate need a strong moment through breakout/Breakdown we noticed buyer trapped in morning to see bank nifty touching lifetime high. you can go long with small stoploss but remember if such pattern would be failed then price probably fall & come to support near neckline, I mean to the place (pattern started) where it began, Banknifty Multiple support also a strong zone near 50-day EMA so it would be value buying zone Near 53500-53800.
So, I am waiting what do u think?

[INTRADAY] #BANKNIFTY PE & CE Levels(03/06/2025)Bank Nifty is expected to open flat around the 55850–55900 zone, continuing near the same levels as the previous session. The index is currently trading in a tight range, indicating potential breakout or reversal zones are nearing.
If Bank Nifty sustains above the 55550–55600 zone, bullish momentum could continue toward 55750, 55850, and 55950+. A clear breakout above 56050 would confirm a fresh upward leg, with extended targets at 56250, 56350, and 56450+.
On the downside, if Bank Nifty slips below 55900–55950, a minor correction is possible with short targets at 55750, 55650, and 55550. Further weakness would only be confirmed below 55450–55400, exposing the downside to 55250, 55150, and 55050.
BankNifty levels - Jun 03, 2025Utilizing the support and resistance levels of BankNifty, along with the 5-minute timeframe candlesticks and VWAP, can enhance the precision of trade entries and exits on or near these levels. It is crucial to recognize that these levels are not static, and they undergo alterations as market dynamics evolve.
The dashed lines on the chart indicate the reaction levels, serving as additional points of significance. Furthermore, take note of the response at the levels of the High, Low, and Close values from the day prior.
We trust that this information proves valuable to you.
* If you found the idea appealing, kindly tap the Boost icon located below the chart. We encourage you to share your thoughts and comments regarding it.
Wishing you successful trading endeavors!

[INTRADAY] #BANKNIFTY PE & CE Levels(02/06/2025)Bank Nifty is expected to open flat around the 55700–55800 zone. If it manages to sustain above the 55550–55600 breakout zone, the bullish trend is likely to continue with upside targets at 55750, 55850, and 55950+. A further breakout above 56050 may fuel extended gains toward 56250, 56350, and 56450+.
On the downside, if Bank Nifty shows weakness and falls below 55900–55950, a short opportunity may arise targeting 55750, 55650, and 55550 zones. A deeper breakdown below 55450–55400 could lead to further downside levels of 55250, 55150, and 55050.
The price action currently suggests consolidation within a range, so wait for a decisive breakout or breakdown before entering. Use strict stop-losses and book partial profits at major levels as the session may remain volatile near resistance.

BNF showing bullish trendBNF 55749 is showing bullish trend supported by Volume indicators.
Resistance at 55941.

Banknifty June series - 1st Week Analysis Banknifty is looking positive for the upcoming week , but upside confirmation only if Banknifty crosses and sustains above 56000-56100. Until then, Banknifty trend is not confirmed, especially for upside. As of now, downside looks limited, but if Banknifty breaches 55000, then we can expect a small retracement . ALL LEVELS ARE MARKED IN THE CHART POSTED.

BankNifty levels - Jun 02, 2025Utilizing the support and resistance levels of BankNifty, along with the 5-minute timeframe candlesticks and VWAP, can enhance the precision of trade entries and exits on or near these levels. It is crucial to recognize that these levels are not static, and they undergo alterations as market dynamics evolve.
The dashed lines on the chart indicate the reaction levels, serving as additional points of significance. Furthermore, take note of the response at the levels of the High, Low, and Close values from the day prior.
We trust that this information proves valuable to you.
* If you found the idea appealing, kindly tap the Boost icon located below the chart. We encourage you to share your thoughts and comments regarding it.
Wishing you successful trading endeavors!

Nifty levels - Jun 02, 2025Nifty support and resistance levels are valuable tools for making informed trading decisions, specifically when combined with the analysis of 5-minute timeframe candlesticks and VWAP. By closely monitoring these levels and observing the price movements within this timeframe, traders can enhance the accuracy of their entry and exit points. It is important to bear in mind that support and resistance levels are not fixed, and they can change over time as market conditions evolve.
The dashed lines on the chart indicate the reaction levels, serving as additional points of significance to consider. Furthermore, take note of the response at the levels of the High, Low, and Close values from the day prior.
We hope you find this information beneficial in your trading endeavors.
* If you found the idea appealing, kindly tap the Boost icon located below the chart. We encourage you to share your thoughts and comments regarding it.
Wishing you success in your trading activities!

[INTRADAY] #BANKNIFTY PE & CE Levels(30/05/2025)Today, Bank Nifty is expected to open flat near the 55600 zone. If it sustains above the 55550–55600 range, a bullish rally may continue with upside targets at 55750, 55850, and 55950+.
Further breakout above 56050 could trigger strong momentum toward higher targets of 56250, 56350, and 56450+.
On the downside, if Bank Nifty slips below the 55450–55400 level, a bearish move may unfold with downside targets at 55250, 55150, and 55050.

Bank Nifty Analysis 30-May-2025 (BIGGER PICTURE): BULL or BEAR?LTP 55546/55765
Resistance: 56189
Supports: 55089/54577
BASE SUPPORTS:53477/51850
Are we ready to go for 57K/59K+?
As long as the above supports hold, BN can move towards 57/59K+
Target Zones:
Zone 1 (min. tgt): 56189-56855-57877
59316
Zone 2 (normal tgt): 60555-61177-62221
Zone 3 (ultimate tgt 1): 64934-65555-67600
Ultimate target 2: 75655

BankNifty levels - May 30, 2025Utilizing the support and resistance levels of BankNifty, along with the 5-minute timeframe candlesticks and VWAP, can enhance the precision of trade entries and exits on or near these levels. It is crucial to recognize that these levels are not static, and they undergo alterations as market dynamics evolve.
The dashed lines on the chart indicate the reaction levels, serving as additional points of significance. Furthermore, take note of the response at the levels of the High, Low, and Close values from the day prior.
We trust that this information proves valuable to you.
* If you found the idea appealing, kindly tap the Boost icon located below the chart. We encourage you to share your thoughts and comments regarding it.
Wishing you successful trading endeavors!

[INTRADAY] #BANKNIFTY PE & CE Levels(29/05/2025)Today, Bank Nifty is expected to open flat near the 55450–55500 zone. If it sustains above the 55550 level, a bullish rally may unfold with potential upside targets of 55750, 55850, and 55950+.
On the downside, if Bank Nifty fails to hold and breaks below the 55450–55400 zone, it could trigger a bearish move toward 55250, 55150, and 55050.
Expect consolidation near key levels. Wait for breakout or breakdown confirmation before entering trades. Use tight stop-loss and book profits at each target.

Bank nifty for 29 may monthly expiry Bank nifty in a zone.
Wait for confirmation
Today is monthly expiry so be aware.

BankBifty 1 hour Cup and Handle Continuation PattenBankBifty 1 hour Cup and Handle Continuation Patten
Stop Loss: 55030.45
Buy Stop: 55856.50
TP1: 57221.90
TP2: Not Set
No Divergence
Risk-Reward = Reward / Risk = 1,365.40 / 2,826.05 ≈ 0.48

BankNifty levels - May 29, 2025Utilizing the support and resistance levels of BankNifty, along with the 5-minute timeframe candlesticks and VWAP, can enhance the precision of trade entries and exits on or near these levels. It is crucial to recognize that these levels are not static, and they undergo alterations as market dynamics evolve.
The dashed lines on the chart indicate the reaction levels, serving as additional points of significance. Furthermore, take note of the response at the levels of the High, Low, and Close values from the day prior.
We trust that this information proves valuable to you.
* If you found the idea appealing, kindly tap the Boost icon located below the chart. We encourage you to share your thoughts and comments regarding it.
Wishing you successful trading endeavors!

[INTRADAY] #BANKNIFTY PE & CE Levels(28/05/2025)Today, Bank Nifty is expected to open flat near the 55350–55400 zone. If it sustains above 55550, bullish momentum can be expected with upside targets of 55750, 55850, and 55950+.
If the index starts falling below 55450–55400, it may trigger a bearish move with downside targets at 55250, 55150, and 55050.
Further weakness can be seen if Bank Nifty breaks below 54950, leading to extended targets of 54750, 54650, and 54550.
On the other side, if Bank Nifty reclaims and sustains above 55050–55100, fresh buying can be considered with potential upside toward 55250, 55350, and 55450+.

BANKNIFTY KEY LEVELS FOR 28/05/2025// The core idea behind this indicator was sparked by a simple but powerful clue:
// 👉 "Mark one level correctly, and the rest of the price action aligns around it."
// From that point onward, everything—the logic, calculation method, and application—has been developed independently through my own analysis and experience.
// I am not a seller, and no one taught me this system. This method is a result of my own effort and refinement.
///////////////////// Explanation /////////////////////
// This trading system is designed to eliminate blind trades by offering confirmation-based entry and exit points.
///////////////////// Entry/Exit Strategy /////////////////////
// - Use the BLACK line for long trades, and the RED line for short trades, in line with confirmation from your trading plan.
// - Stop Loss:
// - For long trades: below the RED line.
// - For short trades: above the BLACK line.
// - Take Profit:
// - For long trades: target the next RED line above.
// - For short trades: target the next BLACK line below.
///////////////////// Recommended Timeframe /////////////////////
// Use on a 5-minute chart for best results.
///////////////////// Disclaimer /////////////////////
// This setup is shared purely for educational purposes.
// I am not responsible for any gains or losses that may result from its use.
// Always use your own judgment and risk management.
