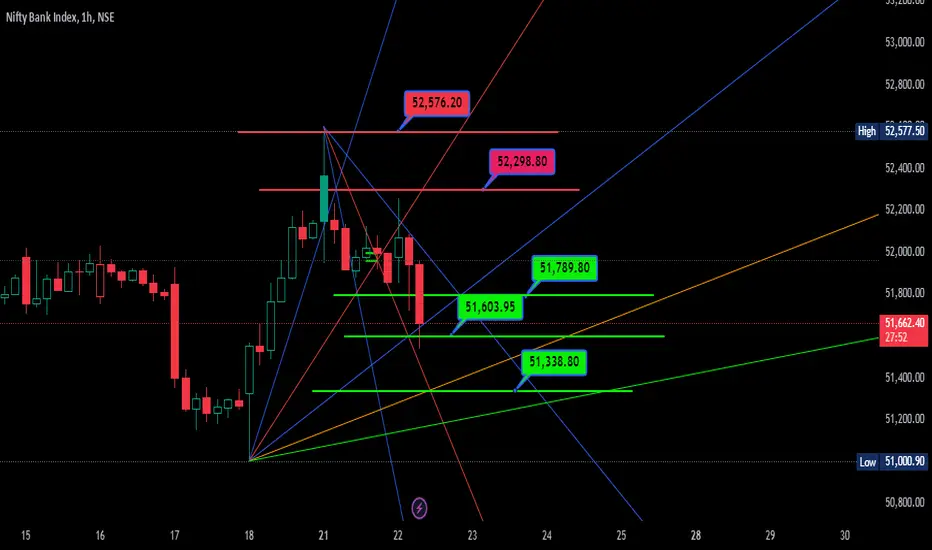
BankNifty Levels for Intraday 23 Oct 2024 Selling TrendToday BankNifty closed below the Trend line / Channel of Daily Timeframe which was started in January which is a sign of trend change and price may go more downside.
As per the today price action (lower low and lower highs) the selling was continue after each rise,
So as per the price action and trend change price is indicating sell on rise market.
So for minimal risk and better risk:reward if price starts moving upwards and taking reversal near 51500, then we can enter for sell trade.
Otherwise if any candle close below today closing price(which act as immediate support/resistance) 51250, then we can also enter for sell trade.
Note : Its just an analysis, wait for the price to confirm.
Disclaimer : Always follow risk to reward, this is the only key to success in market, no matter how much good a trade is looking we never know the future.
BANKNIFTY trade ideas

BANK NIFTY Monthly ChartBank Nifty is heading toward its monthly trendline support from there we can see a nice uptrend rally again or if we see a breakdown of trendline we can see a good sharp fall in coming days

Respecting 1HR FVGOne hour FVG is respected.
if the nifty stops falling and bank nifty will make MSS.
Then can give good move.
NOTE: I do my analysis, do yours before trade.
Eat🍜 Sleep😴 TradingView📈 Repeat 🔁

Banknifty Sell analysisBanknifty start corrective wave downside . daily time period banknifty wave 3rd go downside

Bank Nifty Future map#Bank nifty is moving up but its a correction phase Denoted with WXY in elliott wave theory, above is the possible move. please share it

BANK NIFTYBank nifty coming to its next support .now sustaining but if it broken then it may kiss to next level.one more thing it is trying to make some inverse pattern which is bearish.
[INTRADAY] #BANKNIFTY PE & CE Levels(22/10/2024)Today will be slightly gap down opening in banknifty. After opening expected further downside upto 51550 level. This downside rally can extend for further 400-500 points in case banknifty gives breakdown of 51450 level. Upside rally only expected in case banknifty starts trading and sustain above 52050 level.

Bank Nifty 22nd Oct 2024All important levels, biases and trade ideas marked up on the chart. Follow on X for updates. @anup_kavi

BANKNIFTY : Trading Levels and Plan for 22-Oct-2024Bank Nifty Trading Plan for 22nd October 2024
In the previous session, Bank Nifty traded within a range after facing strong resistance around the 52,216 level. The index remained choppy, testing support near 51,722 but failed to break out of the broader consolidation. As the market prepares for the next trading session, critical levels for breakout or breakdown will determine the direction of movement, particularly around the resistance and support zones marked in the chart.
Gap-Up Opening (200+ Points):
If Bank Nifty opens with a gap-up above 52,216, traders should wait for a sustained breakout above this level to confirm upside momentum.
Long positions can be initiated above 52,216 with targets towards 52,423, which is the last strong intraday resistance.
Once 52,423 is crossed, the next target could be 52,836, but watch for signs of exhaustion near this level.
Place a stop-loss just below 52,216 to protect your position in case of a reversal.
Flat Opening:
In the case of a flat opening near the current price of 51,857, observe how the price behaves around the 51,722-51,655 support/resistance zone.
A breakout above 51,722 could provide a buying opportunity, with upside targets at 52,216 and 52,423.
A failure to hold 51,722 may lead to a downside move towards the next support zone around 51,468.
Stop-loss for long trades should be placed below 51,655, and for short trades, the stop-loss can be kept just above 51,722.
Gap-Down Opening (200+ Points):
If Bank Nifty opens with a gap-down below 51,468, traders should monitor price action closely as it approaches the "Must Try Zone for Buyers" between 51,468 and 51,336.
If buyers step in near 51,336 and defend this level, long positions can be considered, but only after confirming a reversal.
In case the 51,336 level breaks, the next downside target is 50,803, and any further weakness could accelerate the selling pressure.
Keep a stop-loss below 51,336 for long trades, while for short trades initiated at higher levels, the stop-loss can be placed above 51,468.
Risk Management Tips for Options Trading:
Avoid naked options trades in highly volatile scenarios. Use spreads or combination strategies like iron condors to limit risk.
Monitor Bank Nifty’s movement closely near key levels, especially in the 51,722 and 52,216 zones, where premiums can erode quickly due to time decay.
Book profits quickly in options, especially near key resistance levels like 52,423, as sharp reversals are common at such levels.
Ensure proper position sizing and do not over-leverage. Always keep a clear stop-loss in mind based on the levels mentioned above.
Summary & Conclusion:
For 22nd October 2024, Bank Nifty’s key levels are 52,216 on the upside and 51,468 on the downside. A gap-up opening above 52,216 can lead to a test of 52,423, while a gap-down opening below 51,468 could take the index towards the 51,336-50,803 support zones. Flat openings should be traded cautiously, especially around the 51,722 level, which could act as both support and resistance depending on price action. Always use proper risk management strategies when trading options, and avoid trading in uncertain zones without clear breakouts or breakdowns.
Disclaimer: I am not a SEBI registered analyst. This plan is based on my personal analysis using technical parameters. Traders are advised to conduct their own research or consult with a financial advisor before making any trading decisions.

BANKNIFTY KEY LEVELS FOR 22/10/2024//@description
// All credit goes to Tony for the concept of this indicator. His Trading View link: www.tradingview.com
// Note: The calculation method in this indicator differs from Tony's, but the concept is derived from his work.
**Explanation:**
This trading system helps you avoid blind trades by providing confirmation for better entries and exits. It considers volume, past prices, price range and indiavix.
**Entry/Exit Points:**
- **Entry/Exit Lines:** Use the BLACK line for long trades and the RED line for short trades, based on confirmation from your trading plan.
- **Stop Loss:** For long trades, set the stop loss at the RED line below. For short trades, set it at the BLACK line above.
- **Take Profit:** For long trades, target the next RED line above. For short trades, target the next BLACK line below.
**Timeframe:**
Use a 5 timeframe for trading.
**Risk Disclaimer:**
This setup is for educational purposes. I'm not responsible for your gains or losses. Check the chart for more details.

BankNifty Levels for Intraday for 22 Oct 2024BankNifty is trading between support and resistance zone but it is still in bullish channel so trading on buy side has high probability.
We can go long when price starts reversing from 51850-51900.
Trade only when price comes to support zone for good risk to reward and high probability.
Note : Its just an analysis, wait for the price to confirm.
Disclaimer : Always follow risk to reward, this is the only key to success in market, no matter how much good a trade is looking we never know the future.

Nifty & Bank Nifty Analysis and Trade Plan for 22nd OctoberNifty & Bank Nifty Analysis and Trade Plan for 22nd October

bank nifty one last green spike?cmp:51400
bnf if breaks the pattern may result in 4% downside.
my move : avoid longs.
NOTE : just a educational idea not a trading call.

[INTRADAY] #BANKNIFTY PE & CE Levels(21/10/2024)Today will be flat opening in banknifty. After opening if banknifty sustain above 52050 level then expected upside rally upto 52450 level. Below 51950 level expected strong downside upto 51550 level and this can be extend for further 400-500 points in case banknifty starts trading below 51450 level.


Bank Nifty? Will it sustain the bullish momentum?As per my analysis today I think BankNifty will test 51550 before continuing the bullish momentum as the RSI is overbought. So in case of flat I will wait for a dip to buy or in case of gapup I will wait for reversal around 52,800 which may bring us to retest the recent high and 52000 levels. But next few days will be much volatile so don't trade based on guesses and avoid zero hero.

BankNifty is in Bullish ZoneBank Nifty was recover itself into its channel and still trading in bullish channel near bottom of the channel.
Resistance Level is also nearby so wait for the price come to near support level for good risk to reward.
Learning : If any instrument is in bullish trend then all support act as strong support and resistance levels breaks.
Note : Its just an analysis, wait for the price to confirm.
Disclaimer : Always follow risk to reward, this is the only key to success in market, no matter how much good a trade is looking we never know the future.

BANK NIFTY -10 EMA CROSS OVER BNIFTY : Gave a close above its 20 DEMA gives an indication that the run will continue for a while.
I will be a buyer on dips towards 51800 as well if it holds 52200 levels. above 52200 expect it to test 52365 followed by 52 500+. Sustaining at 52500+ levels likely to give a push towards 53000 ZONE. As there is a bullish gap which remains to be filled between 52500-52800 (For educational purpose only)

BANKNIFTY - Trading Levels and Plan for 21-Oct-2024Bank Nifty Trading Plan for 21st October 2024
In the previous session, Bank Nifty moved significantly higher and encountered resistance near the 52,168 level, showing consolidation just below the Opening Resistance/Sideways zone at 52,328. The price action suggests that the market may face further resistance as it approaches the 52,648 Profit Booking Zone. Bank Nifty's trend for 21st October will depend heavily on the opening scenario and its ability to break above these key resistance levels or hold at support zones.
Gap-Up Opening (200+ Points):
If Bank Nifty opens with a gap-up near or above 52,328, it’s important to observe if the price sustains above this zone. A move above 52,328 can quickly lead to a test of the Profit Booking Zone between 52,648 and 52,832.
Long positions can be considered above 52,328, targeting the 52,648-52,832 range. Partial profit booking is recommended near 52,648.
Be cautious if Bank Nifty opens within the Profit Booking Zone (52,648-52,832), as a reversal is possible from these levels.
Place a stop-loss below 52,328 for any long trades initiated after the gap-up opening to manage risk effectively.
Flat Opening:
In case of a flat opening near the 52,138 level, wait for the first 30 minutes to see if the price can sustain above this level.
If the price moves above 52,328, it can offer a good buying opportunity targeting 52,648-52,832.
A failure to sustain above 52,138 could result in a retracement back towards the Opening Support zone at 51,923-51,847. Watch for a potential bounce from these levels for buying opportunities.
Stop-loss should be placed below 51,923 for any long trades in case of a flat opening.
Gap-Down Opening (200+ Points):
If Bank Nifty opens with a gap-down below 51,847, wait for a recovery towards 51,923 before considering any long positions.
A failure to hold 51,847 could lead to further downside pressure, targeting 51,809 and potentially 51,190 (Major Support). Avoid taking aggressive long positions unless a reversal pattern is confirmed near these supports.
For gap-down scenarios, a stop-loss just below 51,809 is recommended to minimize risk exposure.
Avoid attempting to buy falling prices without clear confirmation of support near 51,809 or 51,190.
Risk Management Tips for Options Trading:
Use hedged strategies such as bull call spreads or bear put spreads to limit risk, especially in volatile markets.
Do not hold naked option positions overnight in case of large gap openings, as option premiums can decay rapidly due to time decay.
For intraday options trades, always set defined stop-losses to avoid significant losses in case of sudden market reversals. For example, consider 52,328 as a key level for long call options or 51,809 for long put options.
Ensure to book profits periodically, especially near key resistance or support zones, to avoid losing gains in a volatile market.
Summary & Conclusion:
The key levels to watch for Bank Nifty on 21st October are 52,328 on the upside and 51,809 on the downside. A break and sustain above 52,328 could lead to a strong rally towards the Profit Booking Zone (52,648-52,832), while a breakdown below 51,809 may lead to a sharp correction toward 51,190. Traders should remain cautious within the Opening Resistance/Sideways zone (52,138-52,328) and manage their risk by placing appropriate stop-losses, especially when trading options. Stay disciplined and follow proper risk management strategies to safeguard against potential losses.
Disclaimer: I am not a SEBI registered analyst. This plan is based on my personal analysis using technical parameters. Traders are advised to conduct their own research or consult with a financial advisor before making any trading decisions.

BANK NIFTY S/R for 21/10/24Support and Resistance Levels:
Support Levels: These are price points (green line/shade) where a downward trend may be halted due to a concentration of buying interest. Imagine them as a safety net where buyers step in, preventing further decline.
Resistance Levels: Conversely, resistance levels (red line/shade) are where upward trends might stall due to increased selling interest. They act like a ceiling where sellers come in to push prices down.
Breakouts:
Bullish Breakout: When the price moves above resistance, it often indicates strong buying interest and the potential for a continued uptrend. Traders may view this as a signal to buy or hold.
Bearish Breakout: When the price falls below support, it can signal strong selling interest and the potential for a continued downtrend. Traders might see this as a cue to sell or avoid buying.
20 EMA (Exponential Moving Average):
Above 20 EMA(50 EMA): If the stock price is above the 20 EMA, it suggests a potential uptrend or bullish momentum.
Below 20 EMA: If the stock price is below the 20 EMA, it indicates a potential downtrend or bearish momentum.
Trendline: A trendline is a straight line drawn on a chart to represent the general direction of a data point set.
Uptrend Line: Drawn by connecting the lows in an upward trend. Indicates that the price is moving higher over time. Acts as a support level, where prices tend to bounce upward.
Downtrend Line: Drawn by connecting the highs in a downward trend. Indicates that the price is moving lower over time. It acts as a resistance level, where prices tend to drop.
RSI: RSI readings greater than the 70 level are overbought territory, and RSI readings lower than the 30 level are considered oversold territory.
Combining RSI with Support and Resistance:
Support Level: This is a price level where a stock tends to find buying interest, preventing it from falling further. If RSI is showing an oversold condition (below 30) and the price is near or at a strong support level, it could be a good buy signal.
Resistance Level: This is a price level where a stock tends to find selling interest, preventing it from rising further. If RSI is showing an overbought condition (above 70) and the price is near or at a strong resistance level, it could be a signal to sell or short the asset.
Disclaimer:
I am not a SEBI registered. The information provided here is for learning purposes only and should not be interpreted as financial advice. Consider the broader market context and consult with a qualified financial advisor before making investment decisions.

BANKNIFTY KEY LEVELS FOR 21/10/2024//@description
// All credit goes to Tony for the concept of this indicator. His Trading View link: www.tradingview.com
// Note: The calculation method in this indicator differs from Tony's, but the concept is derived from his work.
**Explanation:**
This trading system helps you avoid blind trades by providing confirmation for better entries and exits. It considers volume, past prices, price range and indiavix.
**Entry/Exit Points:**
- **Entry/Exit Lines:** Use the BLACK line for long trades and the RED line for short trades, based on confirmation from your trading plan.
- **Stop Loss:** For long trades, set the stop loss at the RED line below. For short trades, set it at the BLACK line above.
- **Take Profit:** For long trades, target the next RED line above. For short trades, target the next BLACK line below.
**Timeframe:**
Use a 5 timeframe for trading.
**Risk Disclaimer:**
This setup is for educational purposes. I'm not responsible for your gains or losses. Check the chart for more details.

Banknifty weekly view - October 4th week analysis Banknifty is looking steady and it can give good upside in the upcoming week upto levels if 53400+ the only risk involved is that it can face resistance at 52550 but if it crosses if successfully we can expect good upside. View remains invalidated if banknifty breaches 51600 on the downside.

Nifty & Bank Nifty Analysis and Trade Plan for 21st October ||Nifty & Bank Nifty Analysis and Trade Plan for 21st October ||
