BANKNIFTY trade ideas

[INTRADAY] #BANKNIFTY PE & CE Levels(27/05/2025)Today, Bank Nifty is expected to open flat near the 55550 level. If it sustains above 55550, we may see further bullish momentum with upside targets of 55750, 55850, and 55950+. This breakout level may trigger strong buying interest.
On the downside, if Bank Nifty fails to hold above 55550 and drops below the 55460–55400 zone, then a bearish move may be seen toward 55250, 55150, and 55050 levels.
If it slips further below 55100, another buying opportunity may come near the 55050–55100 zone for a possible bounce targeting 55250, 55350, and 55450+.

BANKNIFTY KEY LEVELS FOR 27/05/2025// The core idea behind this indicator was sparked by a simple but powerful clue:
// 👉 "Mark one level correctly, and the rest of the price action aligns around it."
// From that point onward, everything—the logic, calculation method, and application—has been developed independently through my own analysis and experience.
// I am not a seller, and no one taught me this system. This method is a result of my own effort and refinement.
///////////////////// Explanation /////////////////////
// This trading system is designed to eliminate blind trades by offering confirmation-based entry and exit points.
///////////////////// Entry/Exit Strategy /////////////////////
// - Use the BLACK line for long trades, and the RED line for short trades, in line with confirmation from your trading plan.
// - Stop Loss:
// - For long trades: below the RED line.
// - For short trades: above the BLACK line.
// - Take Profit:
// - For long trades: target the next RED line above.
// - For short trades: target the next BLACK line below.
///////////////////// Recommended Timeframe /////////////////////
// Use on a 5-minute chart for best results.
///////////////////// Disclaimer /////////////////////
// This setup is shared purely for educational purposes.
// I am not responsible for any gains or losses that may result from its use.
// Always use your own judgment and risk management.

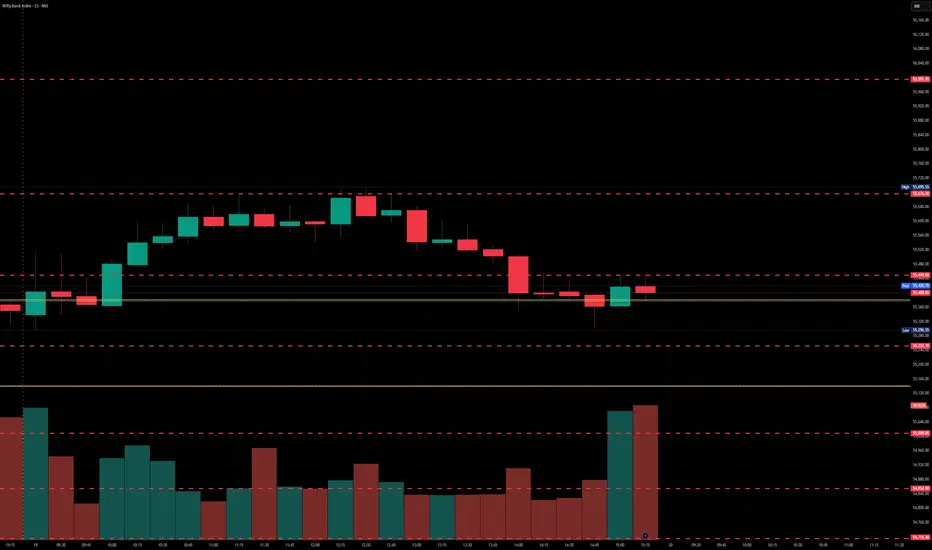
BankNifty levels - May 27, 2025Utilizing the support and resistance levels of BankNifty, along with the 5-minute timeframe candlesticks and VWAP, can enhance the precision of trade entries and exits on or near these levels. It is crucial to recognize that these levels are not static, and they undergo alterations as market dynamics evolve.
The dashed lines on the chart indicate the reaction levels, serving as additional points of significance. Furthermore, take note of the response at the levels of the High, Low, and Close values from the day prior.
We trust that this information proves valuable to you.
* If you found the idea appealing, kindly tap the Boost icon located below the chart. We encourage you to share your thoughts and comments regarding it.
Wishing you successful trading endeavors!
Banknifty M15 UptrendEntry: 54395
Target: 55699
Stop Lose:55243
Price action trading is a methodology where traders make decisions based on the interpretation of actual price movements on a chart, rather than relying primarily on lagging indicators. It involves observing and analyzing candlestick patterns, trend lines, support and resistance levels, and volume to identify potential trading opportunities and manage risk. The focus is on understanding the story the market is telling through its price behavior.

[INTRADAY] #BANKNIFTY PE & CE Levels(26/05/2025)Today, Bank Nifty is expected to open with a gap-up above the 55550 level. If it sustains above this zone, we may see a strong upside rally toward 55750, 55850, and 55950+. This level breakout can trigger bullish momentum for the session.
However, if Bank Nifty fails to hold above 55550 and slips below 55450–55400, then a short trade opportunity arises with downside targets at 55250, 55150, and 55050.
Further weakness can be expected only if Bank Nifty breaks below 54950, opening downside levels of 54750, 54650, and 54550.

BANKNIFTY : Trading levels and Plan for 26-may-2025📊 Bank Nifty Trading Plan – 26-May-2025
Timeframe: 15 Min | Reference Spot Price: 55,389
Gap Opening Threshold: 200+ Points
🚀 Gap-Up Opening (Above 55,589) – 200+ Points
If Bank Nifty opens above 55,589, it will directly enter or hover near the crucial Opening Resistance Zone of 55,417–55,510 and potentially head toward the upper Profit Booking Zone: 55,834–55,999.
🟥 This zone has shown signs of supply in the past and may act as a trap for early breakout buyers if price action isn't strong.
✅ Plan of Action:
– Avoid aggressive longs immediately after the gap-up.
– Wait for price to sustain above 55,510 and then break and close above 55,834 on a 15-min candle to confirm strength.
– If this happens, you may look for long entries targeting 55,999 – 56,065 with stop loss just below 55,700.
– However, if Bank Nifty faces rejection in the red zone (55,834–55,999), then Sell-on-Rise opportunity can be considered with a downside target back to 55,510 – 55,417 and eventually 55,136.
– Use a bearish reversal pattern (like Evening Star or Engulfing) in the red zone to trigger shorts.
🎓 Educational Insight: A gap-up into resistance often gives a false breakout if momentum and volume are not supportive. Always wait for confirmation before going long.
📈 Flat Opening (Between 55,189 – 55,589)
This keeps Bank Nifty between the Opening Support (55,136) and the Opening Resistance Zone (55,417–55,510).
🟧 This is the choppy zone. Expect mixed emotions in the market during the first 15–30 mins.
✅ Plan of Action:
– Avoid early trades in the first 15–30 mins.
– Wait for directional cues.
– If price holds above 55,417 and gives a strong bullish breakout above 55,510, you can ride a potential move toward 55,834–55,999.
– On the downside, if price slips below 55,136, expect momentum to pick up toward 55,005 and possibly 54,758.
– Only trade if clear breakout or breakdown candle appears with volume support.
🎓 Educational Insight: Most fake breakouts happen in flat openings. Let the market show its hand—follow only when structure and strength align.
📉 Gap-Down Opening (Below 55,189) – 200+ Points
A gap-down below 55,189 would bring prices near key demand zones: Opening Support: 55,136, Intraday Support: 55,005, and Last Strong Support: 54,758.
🟩 These levels can either absorb the fall and bounce or lead to further decline if broken decisively.
✅ Plan of Action:
– Observe price action near 55,005 and 54,758.
– If bullish reversal candles (like hammer or bullish engulfing) form and price sustains above support, consider a long setup targeting a bounce back to 55,136 – 55,417.
– On the other hand, if price decisively breaks 54,758, then consider short entries with next downside target in swing low regions (can extend 100–150 pts down).
– Stop loss for longs: below 54,700.
– Stop loss for shorts: above 54,850.
🎓 Educational Insight: Gap-downs to support can offer great R:R long entries if price shows strength. But wait for candle structure to confirm reversal before entering.
🛡️ Options Trading – Risk Management Tips
✅ Don’t rush into trades at the open —allow price structure to develop.
✅ Use slightly ITM options instead of deep OTM for better delta movement and less decay.
✅ Don’t overleverage —risk only 1–2% of your capital per trade.
✅ Always define your stop loss based on spot levels , not just the option premium.
✅ Exit after 2 consecutive stop-losses to maintain discipline and emotional stability.
✅ Book partial profits as the trade moves in your favor and trail SL for the rest.
✅ Avoid chasing momentum blindly ; volume and structure confirmation are key.
📌 Summary & Conclusion
🔹 Opening Resistance Zone: 55,417 – 55,510
🔹 Profit Booking Zone: 55,834 – 55,999
🔹 Opening Support: 55,136
🔹 Last Intraday Support: 55,005
🔹 Final Strong Support: 54,758
📈 For Gap-Ups, watch for price rejection near upper zones or breakouts beyond 55,999.
📉 For Gap-Downs, reversal setups at 55,005 or 54,758 are key—don’t short blindly.
🕒 In Flat Openings, let the market settle for 15–30 minutes. Trade only on confirmation.
⚖️ Best trades occur when price moves away from zones with proper volume, pattern, and structure alignment .
⚠️ Disclaimer:
I am not a SEBI-registered analyst. This trading plan is intended purely for educational purposes. Please do your own analysis or consult a SEBI-registered advisor before initiating any trades.

BNF Trend directionBNF 55398 has resistance at 55648 and support at 54800. Chart looks bearish. FII's have bought 3,456 contracts. Expected to move BNF higher to test resistance and fall to support

BANK NIFTY✅ Trade Plan – Long Entries
Entry # Entry Price SL Risk (pts) Target Last High Last Low
Entry 1 54,054 53,483 571 62,088 56,080 52,063
Entry 2 52,486 51,863 623 60,520 56,080 52,063
🔍 Insights & Strategy
Trend Alignment: All major MTFs and GANN analysis indicate a strong bullish bias.
Entry 1 (54054): Above GANN Long zone → Good for confirmation-based entry.
Entry 2 (52486): Closer to weekly DMIP zone → Attractive for re-entry on dips.
Risk Management:
Entry 1 RR = (62088 – 54054) / 571 ≈ 13.9
Entry 2 RR = (60520 – 52486) / 623 ≈ 12.9
Both have very favorable risk-reward ratios.
Gann Pivot Zone: Between 53,483–54,054 → Critical level for trend reversal or confirmation.
🚦 Trade Guidance
Aggressive Traders: Can enter on dips near 52,486 with tight SL (51,863).
Conservative Traders: Wait for price to hold above 54,054, then go long.
Trail SL as per structure; tighten above 56,000.
Watch for breakout confirmation above 56,080 (last high) for momentum continuation.
📊 Multi-Timeframe (MTF) Demand Zone Analysis – BANK NIFTY
Timeframe Price Action Proximal Distal Average Trade Zone
Yearly Demand Rally Base Rally 41,820 29,687 35,754 BUY
6M Demand Rally - Rally 41,820 38,613 40,217 BUY
Quarterly BUFL 48,450 46,077 47,264 BUY
Monthly Rally Base Rally 48,161 46,580 47,371 BUY
Weekly DMIP 52,063 50,742 51,403 BUY
Weekly SOE DMIP 54,054 53,483 53,769 BUY
🔮 GANN Analysis – Trend Confirmation
Signal Type Price Action Proximal Distal Avg Action
Long & Trail Above GANN 54,054 53,483 53,769 Stay Long
Short & Trail Below GANN 53,483 53,000 53,242 Stay Short

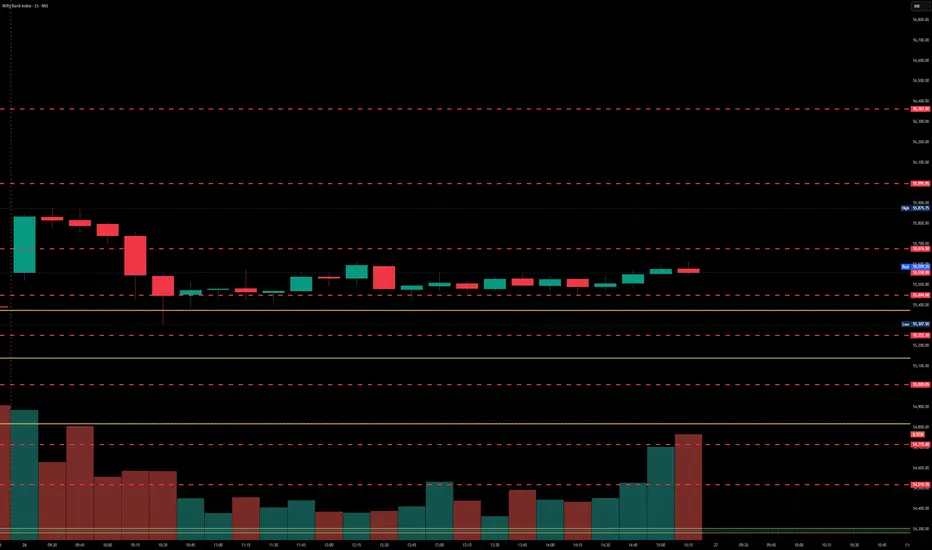
BankNifty levels - May 26, 2025Utilizing the support and resistance levels of BankNifty, along with the 5-minute timeframe candlesticks and VWAP, can enhance the precision of trade entries and exits on or near these levels. It is crucial to recognize that these levels are not static, and they undergo alterations as market dynamics evolve.
The dashed lines on the chart indicate the reaction levels, serving as additional points of significance. Furthermore, take note of the response at the levels of the High, Low, and Close values from the day prior.
We trust that this information proves valuable to you.
* If you found the idea appealing, kindly tap the Boost icon located below the chart. We encourage you to share your thoughts and comments regarding it.
Wishing you successful trading endeavors!
Long on BANK NIFTYBANK NIFTY has consolidated for more than 20 odd days now.
The instrument is now showing a good Bullish sentiment. by forming Higher Lows.
RSI on the Daily chart is also on the verge of breakout of the 60 zone.
I have taken a Long position on it for a Target to 57,700 level
This is taken on the H1 time frame and hence it makes it a swing entry for the June expiry series.
P.S. Not a recommendation. Pls do your own due diligence.

[INTRADAY] #BANKNIFTY PE & CE Levels(23/05/2025)Today, Bank Nifty is expected to open flat. If after opening it starts trading and sustains below the 54950–54900 zone, then a downside move toward 54750, 54650, and 54550 is possible.
Further breakdown below 54450 could lead to extended downside targets at 54250, 54150, and 54050 levels.
On the upside, if Bank Nifty sustains above the 55050–55100 zone, it may trigger a bullish rally toward 55250, 55350, and 55450+. However, 55450 remains a strong resistance zone and any bullish move may reverse from there.

Bank Nifty at a Crossroads: Breakout or Breakdown? Bank Nifty is consolidating in a tight range between 54,000–56,000 . A sustained breakout above 56K can trigger a bullish rally, while a break below 54K may lead to a healthy correction towards 51,200, which coincides with the 200-day moving average and a gap zone (51,800–51,200). Key levels are aligned with both price structure and long-term indicators—worth tracking closely.
Key Levels:
Resistance: 56,000
Support: 54,000
Gap & Major Support Zone: 51,800 – 51,200
Long-Term Support: 200 DMA @ 51,200
Outlook:
Above 56K = Fresh upside momentum
Below 54K = Healthy correction expected
#BankNifty #NiftyBank #TechnicalAnalysis #PriceAction #SwingTrade #BreakoutStrategy #SupportAndResistance #200DMA #GapFill #NSE #TradingViewIndia

BANKNIFTY KEY LEVELS FOR 23/05/2025// The core idea behind this indicator was sparked by a simple but powerful clue:
// 👉 "If you get one level, you get all levels."
// From that point onward, everything—the logic, calculation method, and application—has been developed independently through my own analysis and experience.
// I am not a seller, and no one taught me this system. This method is a result of my own effort and refinement.
///////////////////// Explanation /////////////////////
// This trading system is designed to eliminate blind trades by offering confirmation-based entry and exit points.
///////////////////// Entry/Exit Strategy /////////////////////
// - Use the BLACK line for long trades, and the RED line for short trades, in line with confirmation from your trading plan.
// - Stop Loss:
// - For long trades: below the RED line.
// - For short trades: above the BLACK line.
// - Take Profit:
// - For long trades: target the next RED line above.
// - For short trades: target the next BLACK line below.
///////////////////// Recommended Timeframe /////////////////////
// Use on a 5-minute chart for best results.
///////////////////// Disclaimer /////////////////////
// This setup is shared purely for educational purposes.
// I am not responsible for any gains or losses that may result from its use.
// Always use your own judgment and risk management.

BANK NIFTY S/R for 23/5/24Support and Resistance Levels:
Support Levels: These are price points (green line/shade) where a downward trend may be halted due to a concentration of buying interest. Imagine them as a safety net where buyers step in, preventing further decline.
Resistance Levels: Conversely, resistance levels (red line/shade) are where upward trends might stall due to increased selling interest. They act like a ceiling where sellers come in to push prices down.
Breakouts:
Bullish Breakout: When the price moves above resistance, it often indicates strong buying interest and the potential for a continued uptrend. Traders may view this as a signal to buy or hold.
Bearish Breakout: When the price falls below support, it can signal strong selling interest and the potential for a continued downtrend. Traders might see this as a cue to sell or avoid buying.
MA Ribbon (EMA 20, EMA 50, EMA 100, EMA 200) :
Above EMA: If the stock price is above the EMA, it suggests a potential uptrend or bullish momentum.
Below EMA: If the stock price is below the EMA, it indicates a potential downtrend or bearish momentum.
Trendline: A trendline is a straight line drawn on a chart to represent the general direction of a data point set.
Uptrend Line: Drawn by connecting the lows in an upward trend. Indicates that the price is moving higher over time. Acts as a support level, where prices tend to bounce upward.
Downtrend Line: Drawn by connecting the highs in a downward trend. Indicates that the price is moving lower over time. It acts as a resistance level, where prices tend to drop.
Disclaimer:
I am not a SEBI registered. The information provided here is for learning purposes only and should not be interpreted as financial advice. Consider the broader market context and consult with a qualified financial advisor before making investment decisions.

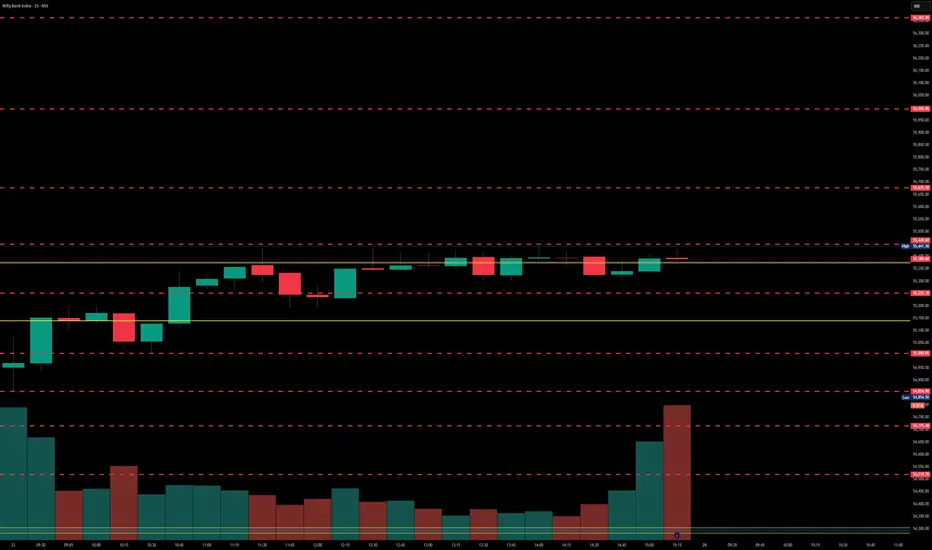
BankNifty levels - May 23, 2025Utilizing the support and resistance levels of BankNifty, along with the 5-minute timeframe candlesticks and VWAP, can enhance the precision of trade entries and exits on or near these levels. It is crucial to recognize that these levels are not static, and they undergo alterations as market dynamics evolve.
The dashed lines on the chart indicate the reaction levels, serving as additional points of significance. Furthermore, take note of the response at the levels of the High, Low, and Close values from the day prior.
We trust that this information proves valuable to you.
* If you found the idea appealing, kindly tap the Boost icon located below the chart. We encourage you to share your thoughts and comments regarding it.
Wishing you successful trading endeavors!

[INTRADAY] #BANKNIFTY PE & CE Levels(22/05/2025)Today, a flat opening is expected in Bank Nifty. After opening, if Bank Nifty starts trading below the 54950 level, a further downside movement is possible towards the 54750, 54650, and 54550 levels during the session.
On the upside, if Bank Nifty begins to trade and sustain above the 55050–55100 zone, it could trigger a bullish move toward 55250, 55350, and potentially 55450+.
However, 55450 will act as a strong resistance for today’s session — any upside rally may face rejection or reversal from this level.
Trade with strict stop loss and keep trailing profits as market can remain range-bound with spikes.

BankNifty levels - May 22, 2025Utilizing the support and resistance levels of BankNifty, along with the 5-minute timeframe candlesticks and VWAP, can enhance the precision of trade entries and exits on or near these levels. It is crucial to recognize that these levels are not static, and they undergo alterations as market dynamics evolve.
The dashed lines on the chart indicate the reaction levels, serving as additional points of significance. Furthermore, take note of the response at the levels of the High, Low, and Close values from the day prior.
We trust that this information proves valuable to you.
* If you found the idea appealing, kindly tap the Boost icon located below the chart. We encourage you to share your thoughts and comments regarding it.
Wishing you successful trading endeavors!

[INTRADAY] #BANKNIFTY PE & CE Levels(21/05/2025)Today will be flat opening expected in banknifty. After opening if banknifty starts trading below 54950 level then possible further downside upto 54550 level in today's session. Upside movement expected if banknifty starts trading and sustain above 55050 level. Upside 55450 level will act as a strong resistance for today's session. Any bullish side rally can be reversal from this level.

BankNifty levels - May 21, 2025Utilizing the support and resistance levels of BankNifty, along with the 5-minute timeframe candlesticks and VWAP, can enhance the precision of trade entries and exits on or near these levels. It is crucial to recognize that these levels are not static, and they undergo alterations as market dynamics evolve.
The dashed lines on the chart indicate the reaction levels, serving as additional points of significance. Furthermore, take note of the response at the levels of the High, Low, and Close values from the day prior.
We trust that this information proves valuable to you.
* If you found the idea appealing, kindly tap the Boost icon located below the chart. We encourage you to share your thoughts and comments regarding it.
Wishing you successful trading endeavors!

BANKNIFTY ANALYSISAfter a major all-time high breakout, BANKNIFTY is consolidating in a range from 54,000-56,000. The concept of BULLISH breakout is that if a breakout happens, prices follows the trend and move upside strongly without giving chance to enter.
But after breakout, if prices get stuck in a range, this shows confusion of participants even after a breakout. Range created by market mostly creates a no-trading zone and it is difficult to analyze the next move.
So, before entering random trades, one should wait for the market to decide which direction it want to follow and be on sidelines till that time.

[INTRADAY] #BANKNIFTY PE & CE Levels(20/05/2025)Today will be flat opening in index. Currently index trading in the consolidation zone. Upside movement can expected if banknifty sustain above 55550 level in today's session. Similarly, Downside expected below 55450 level. Downside 55050 will act as a strong support for today's session.

BankNifty levels - May 20, 2025Utilizing the support and resistance levels of BankNifty, along with the 5-minute timeframe candlesticks and VWAP, can enhance the precision of trade entries and exits on or near these levels. It is crucial to recognize that these levels are not static, and they undergo alterations as market dynamics evolve.
The dashed lines on the chart indicate the reaction levels, serving as additional points of significance. Furthermore, take note of the response at the levels of the High, Low, and Close values from the day prior.
We trust that this information proves valuable to you.
* If you found the idea appealing, kindly tap the Boost icon located below the chart. We encourage you to share your thoughts and comments regarding it.
Wishing you successful trading endeavors!