BankNifty Bullish Trend directionBNF 53354 has sign of strength supported by volume. On chart pattern it has given a flag pattern which is bullish. We expect BNF to touch 57240 with support from 55020.
BANKNIFTY trade ideas

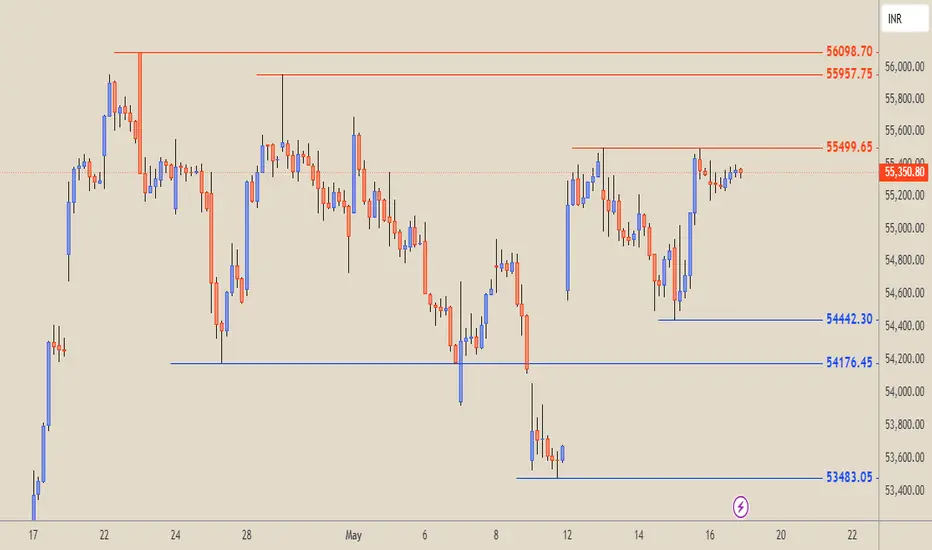
Bank Nifty Levels for 19/05/2025Key Technical Levels
Resistance Zones (Red Lines):
56098.70 (Major swing high)
55957.75 (Strong supply area)
55499.65 (Recently tested resistance)
Support Zones (Blue Lines):
54442.30 (Recent swing low; strong demand zone)
54176.45 (Intermediate support)
53483.05 (Major support; swing low base)
Price Action Analysis
Current Price Behavior:
Price is consolidating just below the 55499.65 resistance level.
The last few candles show reduced volatility and tight range, indicating indecision or a possible accumulation phase.
Prior Trend:
From early May, price shows a higher low and a higher high, suggesting early bullish momentum.
Before that, there was a clear downtrend, as seen from the consistent lower highs and lower lows through April and early May.
Support Reactions:
Strong reaction from the 53483.05 zone, leading to a sharp move up. This confirms demand and buyers’ interest at that level.
The bounce off 54442.30 also validates this as a key support/rescue zone.
Resistance Reactions:
Price was rejected at 55499.65 level previously, suggesting strong selling pressure.
Multiple tests of this level may weaken it eventually.
Outlook Scenarios
Bullish Case:
Break and close above 55499.65 could open the path to test:
55957.75
And then 56098.70
Look for confirmation with a strong bullish candle and higher volume.
Bearish Case:
Failure to break above 55499.65 and a reversal candle pattern could lead to:
Retest of 54442.30
Further breakdown toward 54176.45 or even 53483.05 if selling pressure returns
Technical Summary
Bias: Neutral to Bullish (short-term)
Trend: Recovery from recent downtrend
Watch for:
Breakout above 55499.65
Breakdown below 54442.30
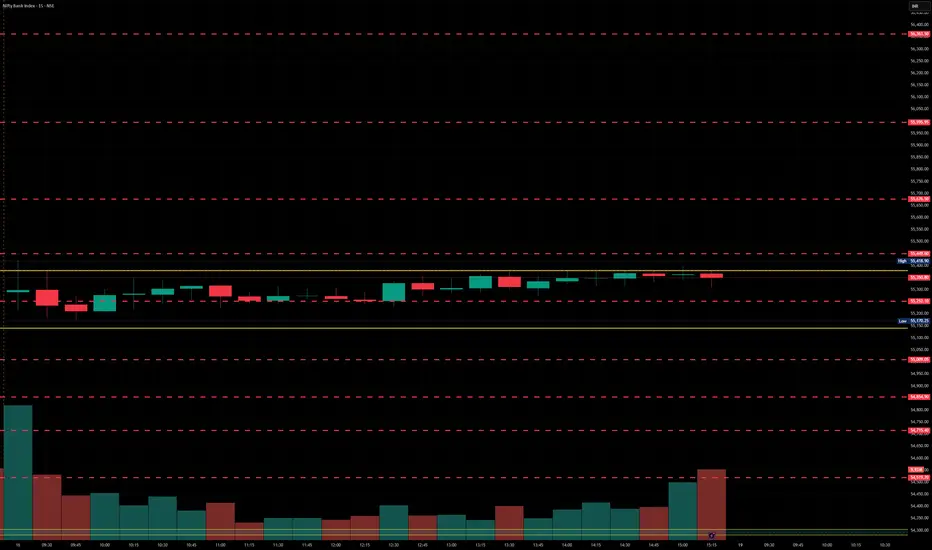
BankNifty levels - May 19, 2025Utilizing the support and resistance levels of BankNifty, along with the 5-minute timeframe candlesticks and VWAP, can enhance the precision of trade entries and exits on or near these levels. It is crucial to recognize that these levels are not static, and they undergo alterations as market dynamics evolve.
The dashed lines on the chart indicate the reaction levels, serving as additional points of significance. Furthermore, take note of the response at the levels of the High, Low, and Close values from the day prior.
We trust that this information proves valuable to you.
* If you found the idea appealing, kindly tap the Boost icon located below the chart. We encourage you to share your thoughts and comments regarding it.
Wishing you successful trading endeavors!
[INTRADAY] #BANKNIFTY PE & CE Levels(16/05/2025)Flat opening in banknifty. After opening if any downside movement can goes reversal from 55050 level. Strong upside rally expected if banknifty starts trading above 55550 level. This upside rally can goes upto 55950+ level in today's session. Any major downside only expected below 54950 level.

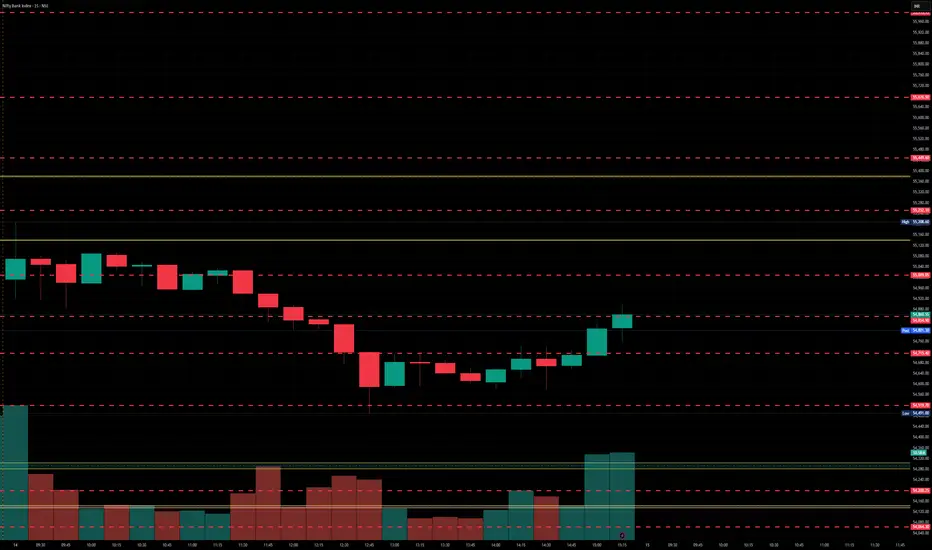
BankNifty levels - May 16, 2025Utilizing the support and resistance levels of BankNifty, along with the 5-minute timeframe candlesticks and VWAP, can enhance the precision of trade entries and exits on or near these levels. It is crucial to recognize that these levels are not static, and they undergo alterations as market dynamics evolve.
The dashed lines on the chart indicate the reaction levels, serving as additional points of significance. Furthermore, take note of the response at the levels of the High, Low, and Close values from the day prior.
We trust that this information proves valuable to you.
* If you found the idea appealing, kindly tap the Boost icon located below the chart. We encourage you to share your thoughts and comments regarding it.
Wishing you successful trading endeavors!

banknifty constantly resistng the same trend line resistancebank nifty shows weakness,taking resistance from a trendline resistance now unless and untill trendline not cross on higher side it will show weak ness.
lower side we can see 53500,53200

[INTRADAY] #BANKNIFTY PE & CE Levels(15/05/2025)Today will be slightly gap up opening expected in banknifty. After opening if banknifty starts trading and sustain above 55050 level then expected bullish movement in index. This movement can goes upto 55450 level and can extend further upto 400-500+ points in case banknifty starts trading above 55550 level. Below 54950 negative movement expected. 54550 level will act as a downside support for banknifty. Major downside movement expected in banknifty below 54450 level.

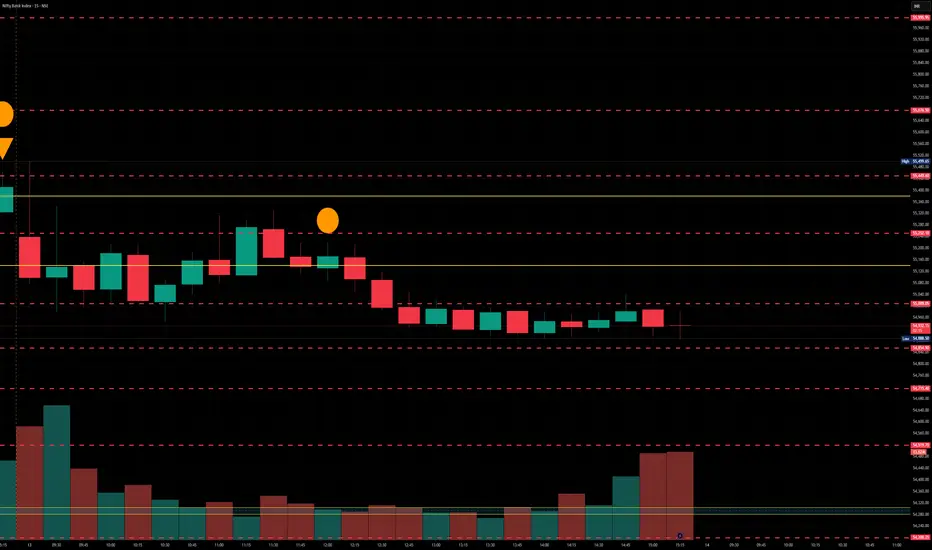
BankNifty levels - May 15, 2025Utilizing the support and resistance levels of BankNifty, along with the 5-minute timeframe candlesticks and VWAP, can enhance the precision of trade entries and exits on or near these levels. It is crucial to recognize that these levels are not static, and they undergo alterations as market dynamics evolve.
The dashed lines on the chart indicate the reaction levels, serving as additional points of significance. Furthermore, take note of the response at the levels of the High, Low, and Close values from the day prior.
We trust that this information proves valuable to you.
* If you found the idea appealing, kindly tap the Boost icon located below the chart. We encourage you to share your thoughts and comments regarding it.
Wishing you successful trading endeavors!
[INTRADAY] #BANKNIFTY PE & CE Levels(14/05/2025)Today will be flat opening expected in index. After opening if banknifty starts trading and sustain above 55050 level then upside movement expected upto 55450+ level. 55450 will act as a resistance for today's session. Possible banknifty will consolidate in between range of 55050-55450 level. In case banknifty gives breakout of 55500 level and starts trading above 55550 then expected strong upside rally of 400-500+ points. Any downside only expected below 54950 level.

BankNifty levels - May 14, 2025Utilizing the support and resistance levels of BankNifty, along with the 5-minute timeframe candlesticks and VWAP, can enhance the precision of trade entries and exits on or near these levels. It is crucial to recognize that these levels are not static, and they undergo alterations as market dynamics evolve.
The dashed lines on the chart indicate the reaction levels, serving as additional points of significance. Furthermore, take note of the response at the levels of the High, Low, and Close values from the day prior.
We trust that this information proves valuable to you.
* If you found the idea appealing, kindly tap the Boost icon located below the chart. We encourage you to share your thoughts and comments regarding it.
Wishing you successful trading endeavors!
BANKNIFTY KEY LEVELS FOR 13/05/2025// The core idea behind this indicator was sparked by a simple but powerful clue:
// 👉 "If you get one level, you get all levels."
// From that point onward, everything—the logic, calculation method, and application—has been developed independently through my own analysis and experience.
// I am not a seller, and no one taught me this system. This method is a result of my own effort and refinement.
///////////////////// Explanation /////////////////////
// This trading system is designed to eliminate blind trades by offering confirmation-based entry and exit points.
///////////////////// Entry/Exit Strategy /////////////////////
// - Use the BLACK line for long trades, and the RED line for short trades, in line with confirmation from your trading plan.
// - Stop Loss:
// - For long trades: below the RED line.
// - For short trades: above the BLACK line.
// - Take Profit:
// - For long trades: target the next RED line above.
// - For short trades: target the next BLACK line below.
///////////////////// Recommended Timeframe /////////////////////
// Use on a 5-minute chart for best results.
///////////////////// Disclaimer /////////////////////
// This setup is shared purely for educational purposes.
// I am not responsible for any gains or losses that may result from its use.
// Always use your own judgment and risk management.

[INTRADAY] #BANKNIFTY PE & CE Levels(13/05/2025)Today will be flat or slightly gap up opening expected in banknifty. After opening if banknifty sustain above 55050 level then expected upside movement upto 55450 and this movement can extend for further 400-500+ points in case banknifty gives breakout of 55550 level. Any downside only expected below 54950 level. Downside 54550 level will act as a strong support for today's session.

BankNifty levels - May 13, 2025Utilizing the support and resistance levels of BankNifty, along with the 5-minute timeframe candlesticks and VWAP, can enhance the precision of trade entries and exits on or near these levels. It is crucial to recognize that these levels are not static, and they undergo alterations as market dynamics evolve.
The dashed lines on the chart indicate the reaction levels, serving as additional points of significance. Furthermore, take note of the response at the levels of the High, Low, and Close values from the day prior.
We trust that this information proves valuable to you.
* If you found the idea appealing, kindly tap the Boost icon located below the chart. We encourage you to share your thoughts and comments regarding it.
Wishing you successful trading endeavors!

[INTRADAY] #BANKNIFTY PE & CE Levels(12/05/2025)Today will be gap up opening in banknifty. Expected opening above 54000 level. After opening if banknifty sustain above this level then expected further extension in this rally towards the 54450 and this can give another 400-500+ points targets if starts trading above 54550 level. Any downside now only expected below 53950 level.

Bank Nifty 54,800–55,600 As we all know, Bank Nifty is highly sensitive and tends to react quickly to news events.
Currently, there is ongoing conflict between India and Pakistan, which has caused Bank Nifty to open with consistent gap-downs, followed by rangebound movement for the rest of the day.
However, recent developments indicate that Pakistan has realized it cannot continue the conflict without risking being removed from the global map. As a result, they are now ready for a ceasefire.
As I said, Bank Nifty is very sensitive, hence we can see a good gap-up opening.
Bank Nifty can jump towards the 0.886 Fibonacci level, which is nothing but 54,800–55,600 zone.
Traders should remain cautious but optimistic, and watch key levels carefully.
Bank NiftyENTRY -1 Long 52,486
SL 51,863
RISK 623
Target as per Entry 63,040
Last High 56,098
Last Low 49,156
ENTRY -2 Long 52,064
SL 50,742
RISK 1,322
Target as per Entry 69,982
Last High 56,098
Last Low 49,156
Bank NIFTY
MTF Analysis Price Action Proximal Distal Average TradeZone
NIFTYYearly Demand BUFL 41830 32155 36993 BUY
NIFTY 6 Month Demand BUFL 41830 33080 37455 BUY
NIFTYQtrly Demand BUFL Rally Base Rally 48636 44429 46533 BUY
NIFTYMonthly Demand Rally Base Rally 46370 45996 46183 BUY
NIFTYWeekly Demand -DMIP BUFL 52064 50742 51403 BUY
NIFTYDaily Demand DMIP LHS BUFL 52486 51863 52175 BUY
GANN Analysis Price Action Proximal Distal Average TradeZone
BANK NIFTY Short & Trail Below GANN 56098 55162 55630 Stay Short
BANK NIFTYLONG & Trail Above GANN 51661 50906 51284 StayLong
NIFTY Current Status Price Action Proximal Distal Average TradeZone
Currently in Weekly Supply Zone 54467 53741 54104 Short

Banknifty May 2nd Week Analysis Banknifty is looking uncertain. But due to global and geopolitical tensions easing,we can expect Banknifty to show good short covering.
IMP TO NOTE : If Banknifty is able to cross and sustain above 54150,then we can expect further upside upto 54800-55100+
Profit booking at higher levels are expected in banknifty , especially at 54800-55200 zone.

BNF 55304 Trend directionBNF 55304 Has breakout from round top pattern and is moving to its technical target of 56239. As FII's have started winding up contracts and profit booking we expect BNF will be moved to its technical target before reversing

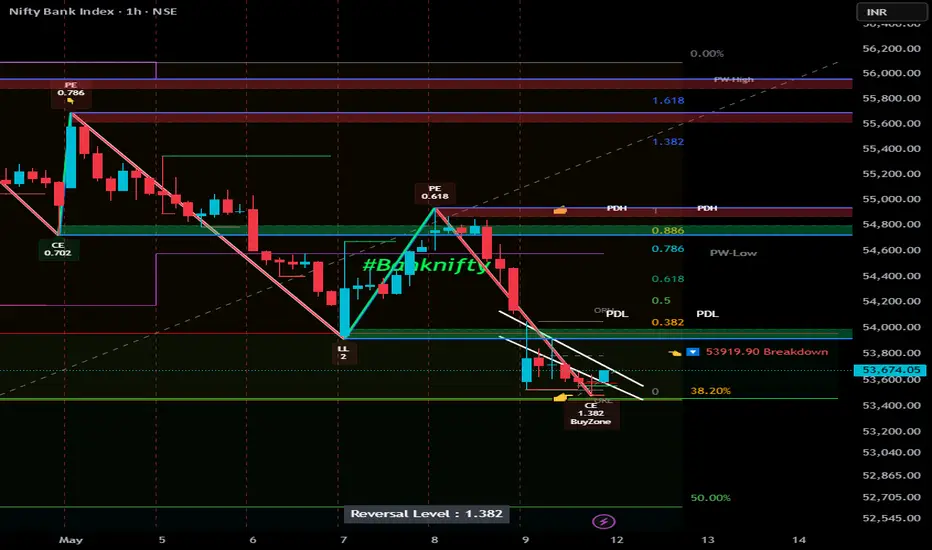
Bank Nify levels for 12/05/2025🧭 Overall Market Structure:
The chart shows strong upward movement earlier, followed by a sharp reversal and ongoing consolidation near support.
The price is currently around 53,674, testing a demand/support zone.
📉 Trend Overview (from the panel):
Timeframe -Trend
D (Daily) - Bullish
4H - Bullish
1H - Bearish
15M - Bearish
5M Bearish
This suggests short-term bearishness, but higher timeframes remain bullish, indicating a pullback within an uptrend.
🔻 Resistance Levels (Marked in Red):
56,098.70 - 55,557.75
55,691.95
54,937.25 - 54,723.70
54,176.45
53,919.90
These levels indicate stacked supply zones, showing strong overhead resistance. Price was rejected near these zones repeatedly, confirming bearish pressure.
🔼 Support Levels (Marked in Blue/Purple):
53,400 area (current price testing support zone)
Lower HTF supports at:
51,893.60
50,742.00
These are key demand levels from higher timeframes. If price loses the 53,400 zone, it may drop towards 51,893 and even 50,742.
📍 Price Action & Candlestick Structure:
A series of lower highs and lower lows forming recently.
Candles near current levels are tight-bodied, indicating indecision.
A bullish bounce from current support is possible, but a breakdown would confirm continuation to the downside.
🧠 Summary:
Trend: Bullish on higher timeframes, Bearish on lower.
Action Zone: Price at major support (53,400)—crucial decision area.
Bias:
Bullish bounce possible toward 54,100–54,700 if support holds.
Bearish continuation likely below 53,400, targets 51,900 and 50,700.

BankNifty levels - May 12, 2025Utilizing the support and resistance levels of BankNifty, along with the 5-minute timeframe candlesticks and VWAP, can enhance the precision of trade entries and exits on or near these levels. It is crucial to recognize that these levels are not static, and they undergo alterations as market dynamics evolve.
The dashed lines on the chart indicate the reaction levels, serving as additional points of significance. Furthermore, take note of the response at the levels of the High, Low, and Close values from the day prior.
We trust that this information proves valuable to you.
* If you found the idea appealing, kindly tap the Boost icon located below the chart. We encourage you to share your thoughts and comments regarding it.
Wishing you successful trading endeavors!
[INTRADAY] #BANKNIFTY PE & CE Levels(09/05/2025)Today will be gap down opening expected in banknifty. Expected opening near 54000 level. After opening if banknifty started trading below 53950 level then expected further downside rally upto 53550 level and this can be extend for further 400-500+ points if it gives breakdown of 53450 level. Any upside movement expected if banknifty sustain above 54050 level.


