[INTRADAY] #BANKNIFTY PE & CE Levels(30/04/2025)Today will be slightly gap up opening expected in banknifty. 55050-55450 zone will be consolidation for banknifty. After opening if banknifty starts trading and sustain above 55550 level then expected upside rally upto 55950+ level in today's session. Any major downside only expected below 54950 level.
BANKNIFTY trade ideas

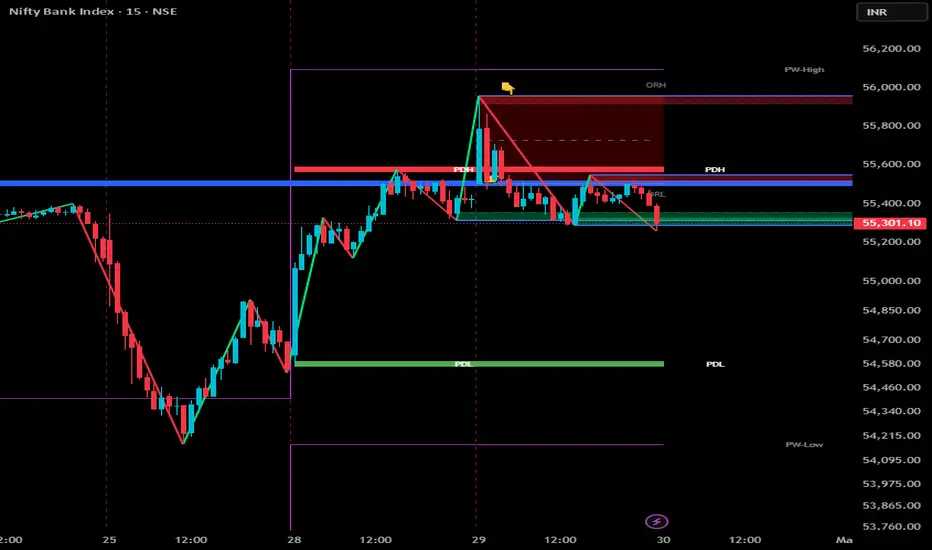
Bank nifty Fibonacci support at 50-61%Bank Nifty formed a double top around the 56,000 mark in the morning session and did not retest that level throughout the trading day.
In fact, it made a lower high and closed near a strong support zone around 55,300. With the market holiday on May 1st and upcoming news flow, charts suggest a possible further correction towards the 54,500–54,580 range.

Bank Nifty 54,500–54,580 range ??Bank Nifty formed a double top around the 56,000 mark in the morning session and did not retest that level throughout the trading day.
In fact, it made a lower high and closed near a strong support zone around 55,300. With the market holiday on May 1st and upcoming news flow, charts suggest a possible further correction towards the 54,500–54,580 range.
#nifty #banknifty #nifty50 #niftybank
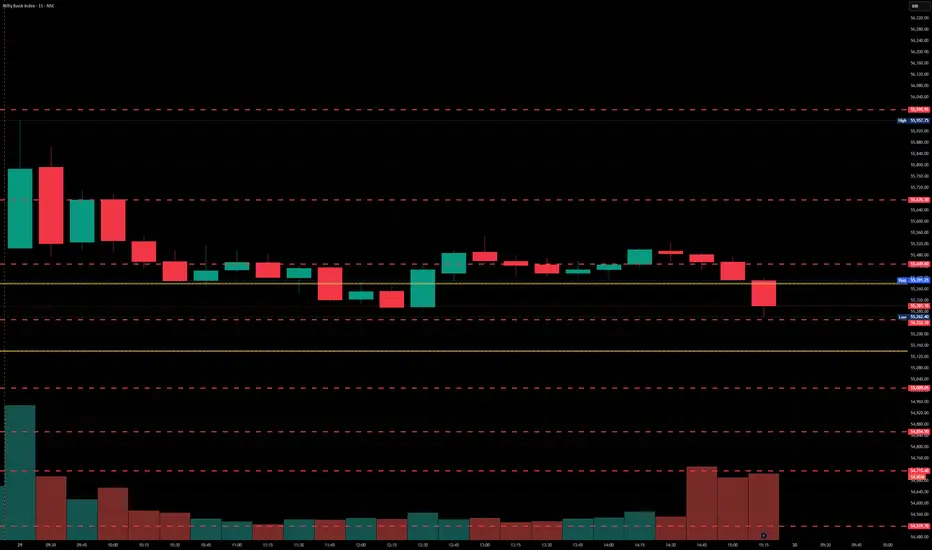
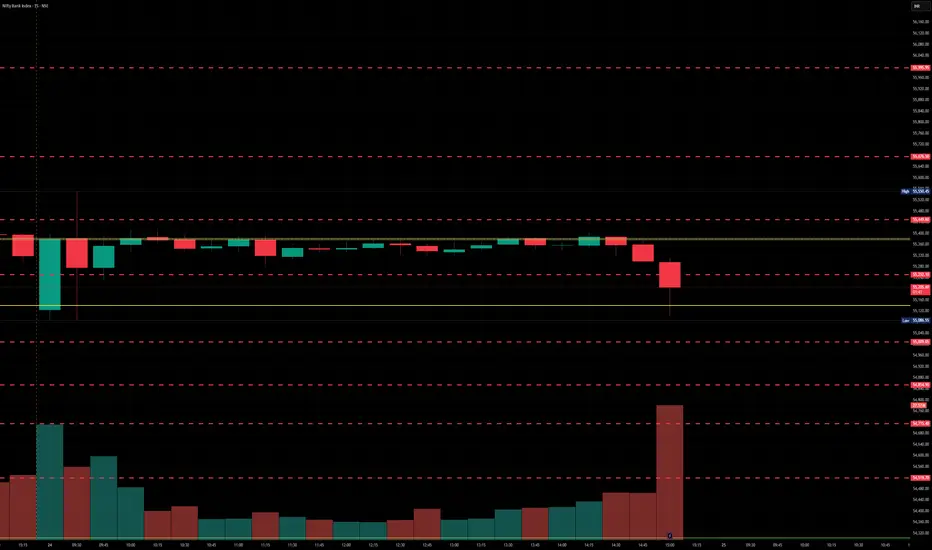
BankNifty levels - Apr 30, 2025Utilizing the support and resistance levels of BankNifty, along with the 5-minute timeframe candlesticks and VWAP, can enhance the precision of trade entries and exits on or near these levels. It is crucial to recognize that these levels are not static, and they undergo alterations as market dynamics evolve.
The dashed lines on the chart indicate the reaction levels, serving as additional points of significance. Furthermore, take note of the response at the levels of the High, Low, and Close values from the day prior.
We trust that this information proves valuable to you.
* If you found the idea appealing, kindly tap the Boost icon located below the chart. We encourage you to share your thoughts and comments regarding it.
Wishing you successful trading endeavors!
[INTRADAY] #BANKNIFTY PE & CE Levels(29/04/2025)Today will be slightly gap up opening expected in banknifty. After opening if banknifty starts trading and sustain above 55550 level then expected further upside rally upto 55950+ level in today's session. 55050-55450 zone will be consolidation for banknifty. Any major downside only expected below 54950 level.

Bank Nifty breakout at 55600 or breakdown 55300Many traders were expecting a market fall — a small correction in Bank Nifty — but as usual, it moved towards Friday’s high.
On the chart, strong support is seen around 24,210.
If 5530 breaks, a good retracement can be expected.
If today’s high is broken, the next level could be around 56100.

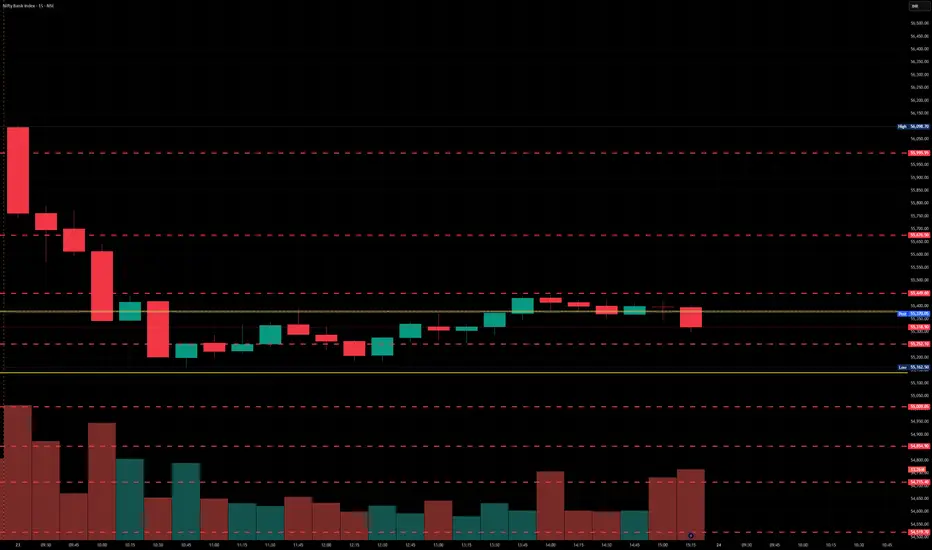
BankNifty levels - Apr 29, 2025Utilizing the support and resistance levels of BankNifty, along with the 5-minute timeframe candlesticks and VWAP, can enhance the precision of trade entries and exits on or near these levels. It is crucial to recognize that these levels are not static, and they undergo alterations as market dynamics evolve.
The dashed lines on the chart indicate the reaction levels, serving as additional points of significance. Furthermore, take note of the response at the levels of the High, Low, and Close values from the day prior.
We trust that this information proves valuable to you.
* If you found the idea appealing, kindly tap the Boost icon located below the chart. We encourage you to share your thoughts and comments regarding it.
Wishing you successful trading endeavors!
[INTRADAY] #BANKNIFTY PE & CE Levels(28/04/2025)Today will be gap up opening expected in banknifty. Expected opening near 54950 level. After opening it will face immediate resistance at this level and possible downside movement in index. Downside 54450-54550 zone will act as a support for today's session. After breakdown of this support zone can lead banknifty further downside upto 54050 level in today's session. Any strong bullish side rally only expected if banknifty starts trading and sustain above 55050 level.

BNF V top pattern .. Reverse signalBNF 54664 has given V top pattern which is a reverse signal has support at 53634. We expect it would get broken and BNF will drop to 49000.

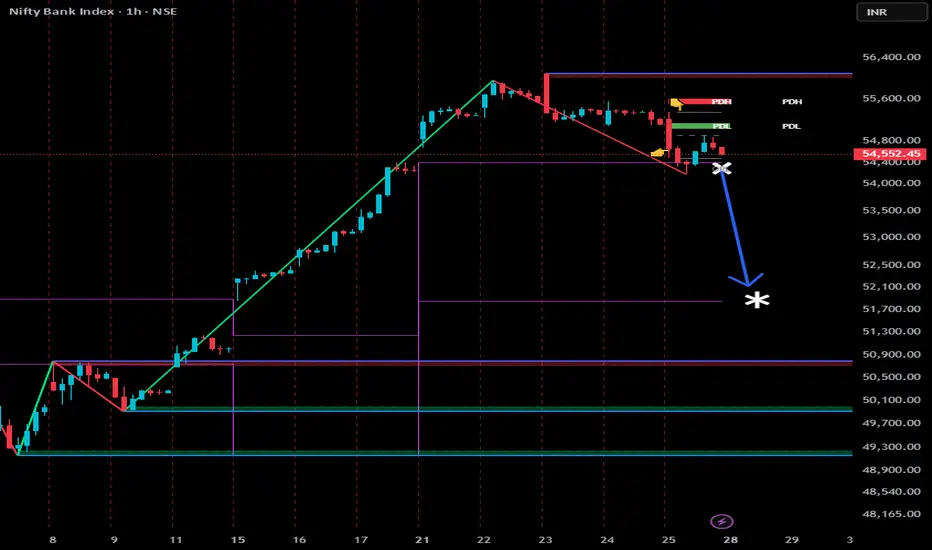
Bank Nifty has marked a new all-time high (ATH).Bank Nifty has marked a new all-time high (ATH).
Now, what’s next?
If the low of Friday, 25th April is breached, we may witness a deeper correction as indicated on the charts.
Traders should stay cautious and closely monitor the price action around key support levels.
A sustained break below the recent low could trigger further downside, while holding above it might invite fresh buying interest.
Banknifty May series ( 1st week analysis )Banknifty can retrace upto 3% in the upcoming week. Single charts are indicating a sell-off . But if market sentiment remains positive, then we can expect it to remain volatile and flat .
Levels to watch on the downside are:
1.)54087
2.)53775
3.)53525
4.)53244
These are the levels which will act as a support and can become a probable zone for short covering.
Upside: If due to any factor, only above 55050 and upto the previous high of 45150-300.

bank nifty trade analysis for shortHTF 15 min -. for analysis
LTF 5 min - entry after it enter the OB
Made an analysis with
FVG ,
OB and liquidity sweep ,
and pools to be swept.
Looking for price to enter the OB that is marked in this chart
Quick trade to down side till the recent low or the FVG by trailing the Stops if it goes in our favour.
Or Cancel the trade if doesn't happen

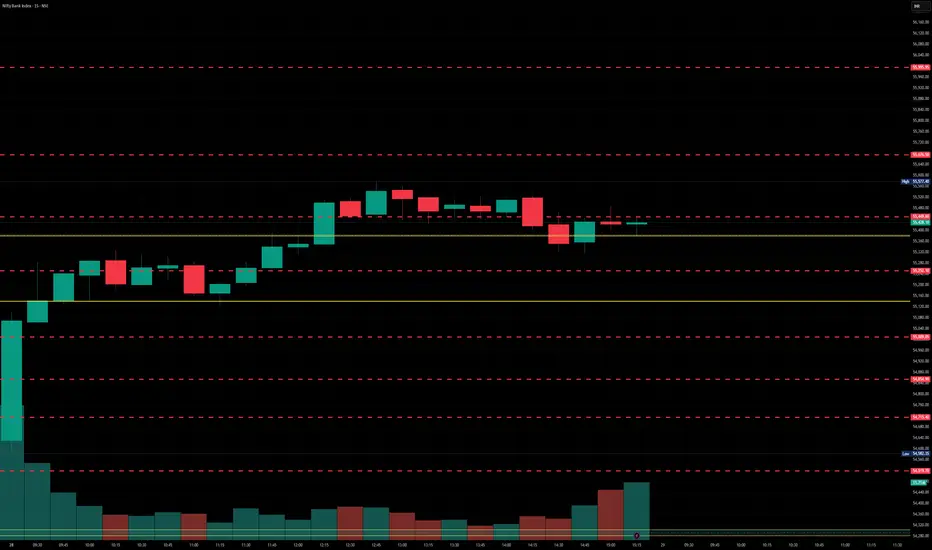
BankNifty levels - Apr 28, 2025Utilizing the support and resistance levels of BankNifty, along with the 5-minute timeframe candlesticks and VWAP, can enhance the precision of trade entries and exits on or near these levels. It is crucial to recognize that these levels are not static, and they undergo alterations as market dynamics evolve.
The dashed lines on the chart indicate the reaction levels, serving as additional points of significance. Furthermore, take note of the response at the levels of the High, Low, and Close values from the day prior.
We trust that this information proves valuable to you.
* If you found the idea appealing, kindly tap the Boost icon located below the chart. We encourage you to share your thoughts and comments regarding it.
Wishing you successful trading endeavors!

[INTRADAY] #BANKNIFTY PE & CE Levels(25/04/2025)Today will be gap up opening expected in index near 55500 level. After opening if banknifty starts trading above 55550 level then expected upside rally of 400-500+ points in opening session. This upside rally can extends for further upto 56450+ level in case banknifty gives breakout of 56050 level. Any downside only expected below 55450 level. Downside 55050 level will act as a important support for today's session.

BANKNIFTY KEY LEVELS FOR 25/04/2025// The core idea behind this indicator was sparked by a simple but powerful clue:
// 👉 "If you get one level, you get all levels."
// From that point onward, everything—the logic, calculation method, and application—has been developed independently through my own analysis and experience.
// I am not a seller, and no one taught me this system. This method is a result of my own effort and refinement.
///////////////////// Explanation /////////////////////
// This trading system is designed to eliminate blind trades by offering confirmation-based entry and exit points.
///////////////////// Entry/Exit Strategy /////////////////////
// - Use the BLACK line for long trades, and the RED line for short trades, in line with confirmation from your trading plan.
// - Stop Loss:
// - For long trades: below the RED line.
// - For short trades: above the BLACK line.
// - Take Profit:
// - For long trades: target the next RED line above.
// - For short trades: target the next BLACK line below.
///////////////////// Recommended Timeframe /////////////////////
// Use on a 15-minute chart for best results.
///////////////////// Disclaimer /////////////////////
// This setup is shared purely for educational purposes.
// I am not responsible for any gains or losses that may result from its use.
// Always use your own judgment and risk management.

Bank Nifty – 1 Hour Chart AnalysisThe price zone between 55,694 and 55,783 is acting as a strong resistance on the 1-hour chart. If the market moves down to sweep the liquidity around 55,551, it could potentially trigger a reversal. This liquidity sweep may give the momentum required for the price to test the resistance zone again.
However, if the resistance holds firm and rejection occurs, it could push the market further down toward the Monthly Support level around 52,441.
Disclaimer:
This analysis is for informational and educational purposes only and should not be considered as investment advice or a recommendation to buy or sell any financial instruments. Trading in the stock market involves risk. Please conduct your own research or consult with a qualified financial advisor before making any trading decisions.

BankNifty level - Apr 25, 2025Utilizing the support and resistance levels of BankNifty, along with the 5-minute timeframe candlesticks and VWAP, can enhance the precision of trade entries and exits on or near these levels. It is crucial to recognize that these levels are not static, and they undergo alterations as market dynamics evolve.
The dashed lines on the chart indicate the reaction levels, serving as additional points of significance. Furthermore, take note of the response at the levels of the High, Low, and Close values from the day prior.
We trust that this information proves valuable to you.
* If you found the idea appealing, kindly tap the Boost icon located below the chart. We encourage you to share your thoughts and comments regarding it.
Wishing you successful trading endeavors!
[INTRADAY] #BANKNIFTY PE & CE Levels(24/04/2025)Today will be slightly gap down opening expected in index. After opening 55050 level will act as a strong support for today's session. Expected reversal from this level. Upside above 55550 level there will be strong bullish rally expected upto 55950+ level in today's session. Any major downside only expected below 55000 level.

BankNifty levels - Apr 24, 2025Utilizing the support and resistance levels of BankNifty, along with the 5-minute timeframe candlesticks and VWAP, can enhance the precision of trade entries and exits on or near these levels. It is crucial to recognize that these levels are not static, and they undergo alterations as market dynamics evolve.
The dashed lines on the chart indicate the reaction levels, serving as additional points of significance. Furthermore, take note of the response at the levels of the High, Low, and Close values from the day prior.
We trust that this information proves valuable to you.
* If you found the idea appealing, kindly tap the Boost icon located below the chart. We encourage you to share your thoughts and comments regarding it.
Wishing you successful trading endeavors!
BANK NIFTY | SHORT | SWINGBANK NIFTY seems to now be in overbought zone.
Price is struggling to form new High and today morning there was a big sell off.
There is also a H&S pattern formation visible on the 15 chart.
Basis these, I have taken a short position for a Target to the 200 MA of the 15 min.
This is a Mean Reversion trade as I feel that the BN is overstretched and a snap back is imminent.

[INTRADAY] #BANKNIFTY PE & CE Levels(23/04/2025)Today will be gap up opening expected in index near 55950 level. After opening expected banknifty will trade in between level of 55550 to 55950 zone in starting session. Strong upside rally expected if banknifty gives breakout of 56000 level and starts trading above 56050. This upside rally can goes upto 56450+ level in today's session. Any major downside only expected below 55450 level.

Nifty Bank - 4000 Points Move Expecting 4000 Points Move - It could be either up or down and the calculation based on the volatality only. The level mentioned here are purely for study purpose only.

BANKNIFTY KEY LEVELS FOR 23/04/2025// All credit goes to Tony for the concept of this indicator. His Trading View link: tradingview.com/u/tony_fx_sm/
// Note: The calculation method in this indicator differs from Tony's, but the concept is derived from his work.
I want to make it clear that I am not a seller, and this method was not taught to me by anyone. The original creator only gave me one clue:
👉 "If you get one level, you get all levels."
Everything else—the way I nail it the method and applied it—is my own work. I respect the original idea, but my approach is independent.
Explanation:
This trading system helps you avoid blind trades by providing confirmation for better entries and exits.
Entry/Exit Points:
- Entry/Exit Lines: Use the BLACK line for long trades and the RED line for short trades, based on confirmation from your trading plan.
- Stop Loss: For long trades, set the stop loss at the RED line below. For short trades, set it at the BLACK line above.
- Take Profit: For long trades, target the next RED line above. For short trades, target the next BLACK line below.
Timeframe:
Use a 5 mins timeframe for trading.
Risk Disclaimer:
This setup is for educational purposes. I'm not responsible for your gains or losses. Check the chart for more details
