ew from tare level - 2020 low - bn - possibilityEliott wave count from covid swing lows banknifty looks to hit the projected ew5 target.
final target may exceed or fall short wrt political developments and eta
BANKNIFTY trade ideas

[INTRADAY] #BANKNIFTY PE & CE Levels(22/04/2025)Today will be flat or slightly gap up opening expected in banknifty. After opening it will face immediate resistance at 55450 level. If banknifty gives breakout of this resistance zone and starts trading above 55550 level then expected strong bullish rally towards the 55950+ level in today's session. Downside 55050 will act as an important support level for banknifty.

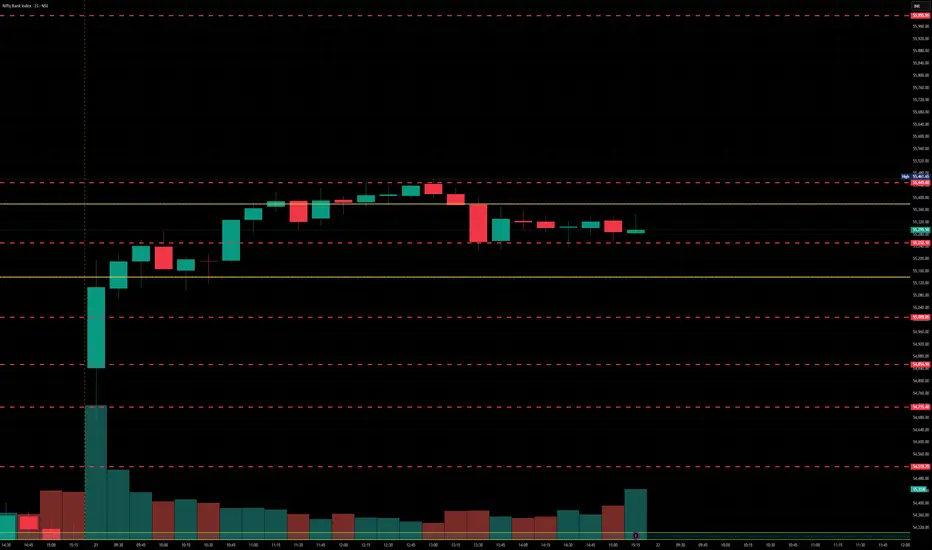
BankNifty levels - Apr 22, 2025Utilizing the support and resistance levels of BankNifty, along with the 5-minute timeframe candlesticks and VWAP, can enhance the precision of trade entries and exits on or near these levels. It is crucial to recognize that these levels are not static, and they undergo alterations as market dynamics evolve.
The dashed lines on the chart indicate the reaction levels, serving as additional points of significance. Furthermore, take note of the response at the levels of the High, Low, and Close values from the day prior.
We trust that this information proves valuable to you.
* If you found the idea appealing, kindly tap the Boost icon located below the chart. We encourage you to share your thoughts and comments regarding it.
Wishing you successful trading endeavors!
BANK NIFTY S/R for 21/4/25Support and Resistance Levels:
Support Levels: These are price points (green line/shade) where a downward trend may be halted due to a concentration of buying interest. Imagine them as a safety net where buyers step in, preventing further decline.
Resistance Levels: Conversely, resistance levels (red line/shade) are where upward trends might stall due to increased selling interest. They act like a ceiling where sellers come in to push prices down.
Breakouts:
Bullish Breakout: When the price moves above resistance, it often indicates strong buying interest and the potential for a continued uptrend. Traders may view this as a signal to buy or hold.
Bearish Breakout: When the price falls below support, it can signal strong selling interest and the potential for a continued downtrend. Traders might see this as a cue to sell or avoid buying.
MA Ribbon (EMA 20, EMA 50, EMA 100, EMA 200) :
Above EMA: If the stock price is above the EMA, it suggests a potential uptrend or bullish momentum.
Below EMA: If the stock price is below the EMA, it indicates a potential downtrend or bearish momentum.
Trendline: A trendline is a straight line drawn on a chart to represent the general direction of a data point set.
Uptrend Line: Drawn by connecting the lows in an upward trend. Indicates that the price is moving higher over time. Acts as a support level, where prices tend to bounce upward.
Downtrend Line: Drawn by connecting the highs in a downward trend. Indicates that the price is moving lower over time. It acts as a resistance level, where prices tend to drop.
Disclaimer:
I am not a SEBI registered. The information provided here is for learning purposes only and should not be interpreted as financial advice. Consider the broader market context and consult with a qualified financial advisor before making investment decisions.

[INTRADAY] #BANKNIFTY PE & CE Levels(21/04/2025)Slightly gap down opening expected in banknifty. After opening expected downside movement upto 54050 level. 54000 level will act as a strong support for today's session. Expected reversal from this level towards the 54450+ and this can be extend for further upside rally if banknifty starts trading above 54550 level. Above this level banknifty can goes upto 54950+ level in today's session. Any major downside only expected below 53950 level.

Accumulation in BANKNIFTY? a rally to 60,000 in near future?Bank Nifty has completed its range of accumulation and is headed for a rally to approx. target of 60k (most likely in strength by this quarter).
The Index was in Spring pad at 13th March,
Broken the Stride at 18th March
24th March was entering into the accumulation zone again in strength,
this all started with a Preliminary Climax price texture on 4th June, followed by a buying climax on 27th June, then an automatic reaction largest to its other price texture which completed on 6th August
a Terminal shakeout from 6th Jan to 11th March, Volume is Increasing on Rallies and reducing on Reactions
A Potential Target of 60,000 is on Cards, won't be surprised if this happens in the coming 2 months too

Bank Nifty-15MHere are the levels for bank nifty to trade for tomorrow intraday and mark these levels on the chart.
Price is at all time high. And compared to nifty bank nifty is extreme bullish and levels of price of these both are does not matching so either nifty should come or bank nifty should go down.
For tomorrow intraday trading buy trades should be planned only at the fib retracement levels. and Not interested for sell trades. Better to wait and trade may be price may go sideways.
TIP: Always buy the at low and sell at high.
Here I mention only the high probability trades only. as intraday trader you can have multiple entries and exits according to your setups.
DISCLAIMER: This is my own analysis and you do your own analysis before you take any trade and I am not SEBI registered and contact your financial adviser before taking any trades .I am not responsible for your profit or loss. This is only for educational purpose and learning.
comment below if you have any doubts.

BANKNIFTY -CnH - BO -Daily Here's a technical analysis of the **Bank Nifty (Nifty Bank Index)** chart you've shared:
---
### 🧠 **Pattern Analysis: Cup & Handle + Double Bottom**
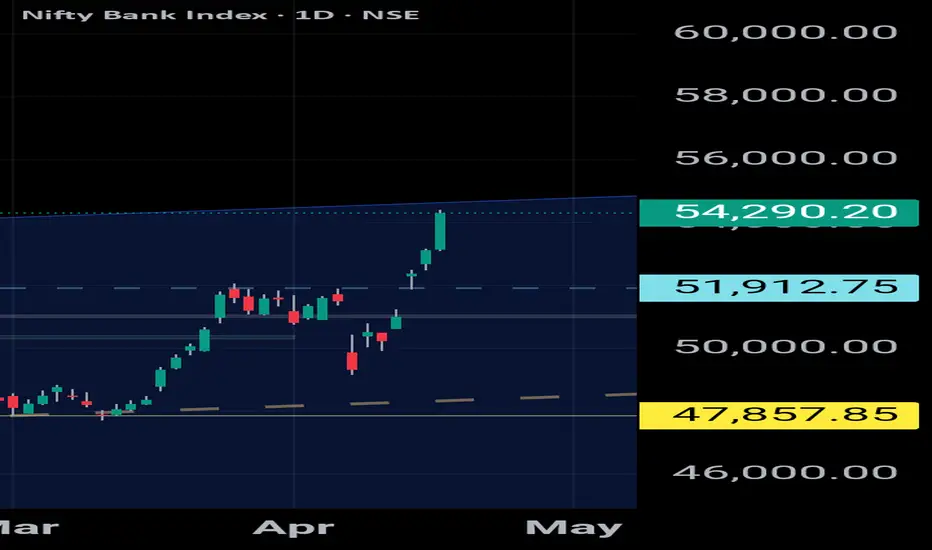
- The chart clearly shows a **Cup and Handle** pattern forming from **December 2024 to mid-April 2025**, followed by a **bullish breakout** above the neckline at **₹51,990.40**.
- Within the base of the cup, there is also a visible **Double Bottom** (highlighted on chart), adding further **bullish confluence**.
---
### 💥 **Breakout Confirmation**
- **Neckline**: ₹51,990.40
- **Current price**: ₹54,290.20 (Already broken out with strong follow-through)
- Breakout candle shows a **2.21% gain** with **high volume**, confirming a **valid breakout**
---
### 🎯 **Target Projection**
- **Cup depth**: ~₹4,111.85
- **Target = Neckline + Depth = ₹51,990 + ₹4,111 = ₹56,100** (aligned with resistance at **₹56,050.70** on chart)
- Also, an alternative smaller cup handle gives a target of ~**₹54,467**, which seems to be almost achieved
---
### 📊 **Volume Analysis**
- Strong volume spike at the breakout = confirmation of institutional buying
- Volume also increased on the right side of the cup and during the handle, which is ideal in such patterns
---
### 🧱 **Support and Resistance Levels**
- **Immediate Support**: ₹51,990 (neckline)
- **Major Support Below**: ₹47,870 and ₹47,702 (double bottom zone)
- **Next Resistance Zone**: ₹56,050.70 (cup projection target)
---
### 📌 **Summary**
- ✅ **Bullish breakout from Cup & Handle**
- ✅ Double Bottom within the structure adds confidence
- ✅ Volume confirmation present
- 📈 **Upside Target**: ₹56,000+ zone
- 🔁 Potential for retest of ₹52,000 before continuation

BANKNIFTY FOR 21 APR#Execution only after break and close above or below from resistance or support 15-minute candle.
#Stop Loss above or below from resistance or support 15-minute candle.
(S/R Levels Will be Flipped in The Situation of Gap up OR Gap down Open, Support Will Turn in Resistance and Resistance Will Turn in Support)
(This Analysis and idea is based only on support and resistance mechanism, Buy after resistance break and close above sell after support break and close below, Closing below resistance after trade will be stop loss likewise closing above support will be a stop loss after trade)
NOTE- Only for Education Purpose. This is not any kind of Trading advice I am giving by this analysis.
NOTE : This is my pre market analysis and my trading journal. Not a suggestion to buy or sell.

Banknifty Monthly Expiry week analysis Nifty Bank is looking positive on charts, but now it will be important to see if it will sustain this upside move. If it does, we can expect new all-time high levels upto 55260-55524+ in the upcoming week . Otherwise, we can expect some retracement in BankNifty in the later half of the upcoming week.

BNF TREND DIRECTIONBNF 54290 - is in oversold region. it has breakout from 'w' pattern and has achieved its technical target. Support is at 53920. It it breaks will drop down to neckline

Bnf Next weekIt's at top of the channel, may fall now.
Global cues like Deterence on Iran, Infosys weak market cues etc
support bearish move
BankNifty levels - Apr 21, 2025Utilizing the support and resistance levels of BankNifty, along with the 5-minute timeframe candlesticks and VWAP, can enhance the precision of trade entries and exits on or near these levels. It is crucial to recognize that these levels are not static, and they undergo alterations as market dynamics evolve.
The dashed lines on the chart indicate the reaction levels, serving as additional points of significance. Furthermore, take note of the response at the levels of the High, Low, and Close values from the day prior.
We trust that this information proves valuable to you.
* If you found the idea appealing, kindly tap the Boost icon located below the chart. We encourage you to share your thoughts and comments regarding it.
Wishing you successful trading endeavors!

BAnkniftyIndian market is continuously ready to make a new high. Will banknifty make a new high. As axis bank and hdfc bank is ATH. Or it will curse down.

[INTRADAY] #BANKNIFTY PE & CE Levels(17/04/2025)Today will be gap down opening expected in index. After opening if banknifty starts trading below 52950 level then downside movement possible upto 52550 level. 52550 level will act as a strong support for today's session. Any downside rally can be reversal from this level. Upside rally expected if banknifty starts trading and sustain above 53050 level. This upside rally can goes upto 53450+ level.

BANK NIFTY 52800BANK NIFTY 52800
Current Status: Bank Nifty is trading around 51,002.35, up 1.52%
BUT DOW SAME FALL

BankNifty levels - Apr 17, 2025Utilizing the support and resistance levels of BankNifty, along with the 5-minute timeframe candlesticks and VWAP, can enhance the precision of trade entries and exits on or near these levels. It is crucial to recognize that these levels are not static, and they undergo alterations as market dynamics evolve.
The dashed lines on the chart indicate the reaction levels, serving as additional points of significance. Furthermore, take note of the response at the levels of the High, Low, and Close values from the day prior.
We trust that this information proves valuable to you.
* If you found the idea appealing, kindly tap the Boost icon located below the chart. We encourage you to share your thoughts and comments regarding it.
Wishing you successful trading endeavors!

bank nifty 53200bank nifty 53200
Bank Nifty is currently showing strong buy signals based on technical indicator

[INTRADAY] #BANKNIFTY PE & CE Levels(16/04/2025)Today will be gap up opening in banknifty. After opening if banknifty starts trading above the 52550 level then this bullish rally can goes upto 52950 level in opening session. This can be extend for further 400-500+ points in case banknifty gives breakout of 53000 level and sustain above 53050 level. 52950 level will act as a resistance for today's session. Any reversal can gives downside movement upto 52550 level. Any major downside only expected below 52450 level.

Banknifty 15Min crossoverBanknifty 15 Min Crossover formation
Important support and resistance in 15 min timeframe

BANK NIFTY -15MHere are the levels for bank nifty to trade for tomorrow intraday and mark these levels on the chart.
If price gap down or flat i will wait till the box pattern is broken below and on retest i will enter the short trade, if price opens gap up will wait for price forms any lower lows and lower highs and then on the volume confirmation will take a short trades only at higher levels.
For buying i am not much interested because it has fill the gap. there is a imbalance created.
It is just my thoughts it does not mean it will exactly the same it is just my view.
If you think I am wrong you can share you views below thank you.
TIP: Always buy the at low and sell at high.
Here I mention only the high probability trades only. as intraday trader you can have multiple entries and exits according to your setups.
DISCLAIMER: This is my own analysis and you do your own analysis before you take any trade and I am not SEBI registered and contact your financial adviser before taking any trades .I am not responsible for your profit or loss. This is only for educational purpose and learning.
comment below if you have any doubts.

Nifty Bank Index Chart Observations:
Pattern:
Price has been forming lower highs, suggesting a descending trendline resistance.
There's a visible breakout attempt above this trendline now.
Support Zone:
Strong demand zone between 46,800 – 48,000, which was respected multiple times.
Indicators:
RSI is near the overbought zone, but not showing divergence.
Volume has spiked on the breakout – bullish confirmation.
Heikin Ashi candles are strongly green – good momentum.
✅ Bullish Scenario (If breakout holds):
Entry Zone: On retest of the breakout trendline (around 51,500–52,000).
Target Levels:
Short-term: 53,500
Medium-term: 55,000–56,000
Stop Loss: Below 50,500
❌ Bearish Scenario (If breakout fails):
Invalidation Level: If it closes back below the trendline with high volume.
Re-entry zone: Watch the 48,000 support area again.
Short Target (if breakdown from support): 46,000–45,000
Swing Traders: Wait for a pullback toward the trendline and enter on bullish confirmation.
Positional Traders: Enter partially now, add more on pullback confirmation.
Risk Management: Keep positions light until breakout is fully confirmed.

Banknifty levels - Apr 16, 2025Utilizing the support and resistance levels of BankNifty, along with the 5-minute timeframe candlesticks and VWAP, can enhance the precision of trade entries and exits on or near these levels. It is crucial to recognize that these levels are not static, and they undergo alterations as market dynamics evolve.
The dashed lines on the chart indicate the reaction levels, serving as additional points of significance. Furthermore, take note of the response at the levels of the High, Low, and Close values from the day prior.
We trust that this information proves valuable to you.
* If you found the idea appealing, kindly tap the Boost icon located below the chart. We encourage you to share your thoughts and comments regarding it.
Wishing you successful trading endeavors!
