BANKNIFTYBanknifty levels are based on imbalances
1. gapup 51900 long
2. 51900-51600 trade breakout
3. gapdown 51600 short
BANKNIFTY1! trade ideas

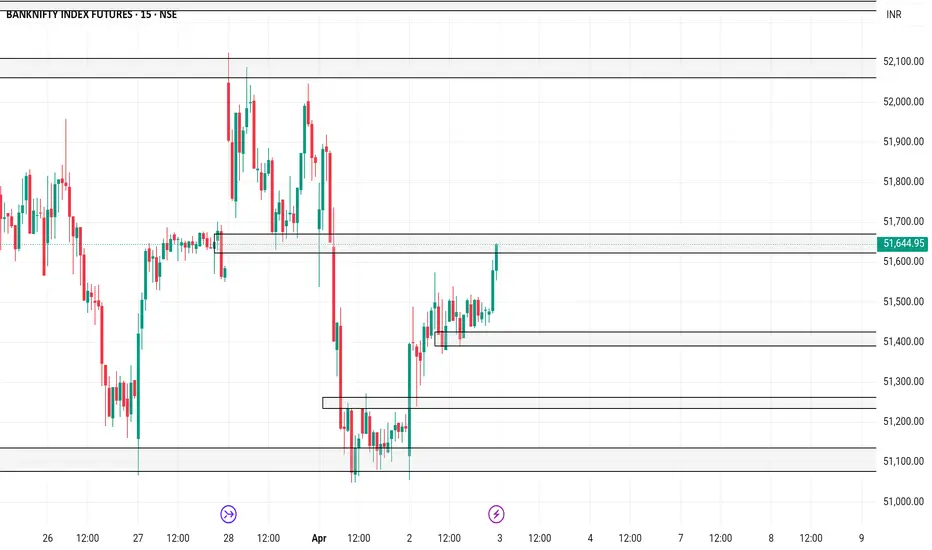
BANKNIFTYBanknifty levels are based on imbalances
1. gapup 51700 long
2. 51700-51400 trade breakout
3. gapdown 51400 short
BANKNIFTYBanknifty levels are based on imbalances
1. gapup 51300 nlong
2. 51300-51100 trade breakout
3. gapdown 51100 short

Bank Nifty FutureBank Nifty Future
MTF Analysis
Bank NiftyYearly Demand 41,820
Bank Nifty 6 Month Demand 44,893
Bank NiftyQtrly Demand BUFL 48,870
Bank NiftyMonthly Demand 44,820
Bank NiftyWeekly Demand 47,763
Bank NiftyWeekly Demand 48,698
Bank NiftyDaily Demand DMIP 50,187
ENTRY -1 Long 50,168
SL 50,000
RISK 168
Target as per Entry 56,449
RR 37
Last High 52,100
Last Low 47,751

BANKNIFTYBanknifty levels are based oon imbalances
1. gapup 52200 long
2. 52200-51600 trade breakout
3. gapdown 51600 short

Review and plan for 28th March 2025Nifty future and banknifty future analysis and intraday plan in kannada.
This video is for information/education purpose only. you are 100% responsible for any actions you take by reading/viewing this post.
please consult your financial advisor before taking any action.
----Vinaykumar hiremath, CMT

BANKNIFTYBanknifty levels are based on imbalances
1. gapup 51800 long
2. 51800-51500 trade breakout
3. gapdown 51500 short

BANKNIFTYBanknifty levels are based on imbalances
1. gapup 51500 long
2. 51500-51200 trade breakout
3. gapdown 51200 short

BANKNIFTYBanknifty levels are based on imbalances
1. gapup 51800 long
2. 51800-51500 trade breakout
3. gapdown 51500 short

BANKNIFTYBanknifty levels are based on imbalances
1. gapup 52000 long
2. 52000-51600 trade breakout
3. gapdown 51600 short

BANKNIFTYBanknifty levels are based on imbalances
1. gapup 50600 long
2. 50600-50300 trade breakout
3. ga [pdown 50300 short

BANKNIFTYBanknifty levels are based on imbalances
1. gapup 50300 long
2.50300-49850 trade breakouit
3. gapdown 49800 short

BANKNIFTYBanknifty levels are based on imbalances
1. gapup 50000 long
2. 50000-49700 trade breakout
3. gapdown 49700 short

Plan for 19th March 2025 Nifty future and banknifty future analysis and intraday plan.
This video is for information/education purpose only. you are 100% responsible for any actions you take by reading/viewing this post.
please consult your financial advisor before taking any action.
----Vinaykumar hiremath, CMT

BANKNIFTYBanknifty levels are based on imbalances
1. gapup 49550 long
2. 49550-49200 trade breaklout
3. gapdown 49200 short

BANKNIFTYBanknifty levels are based on imbalances
1. gapup 48550 long
2. 48550-48350 trade breakout
3. gapdown 48350 short

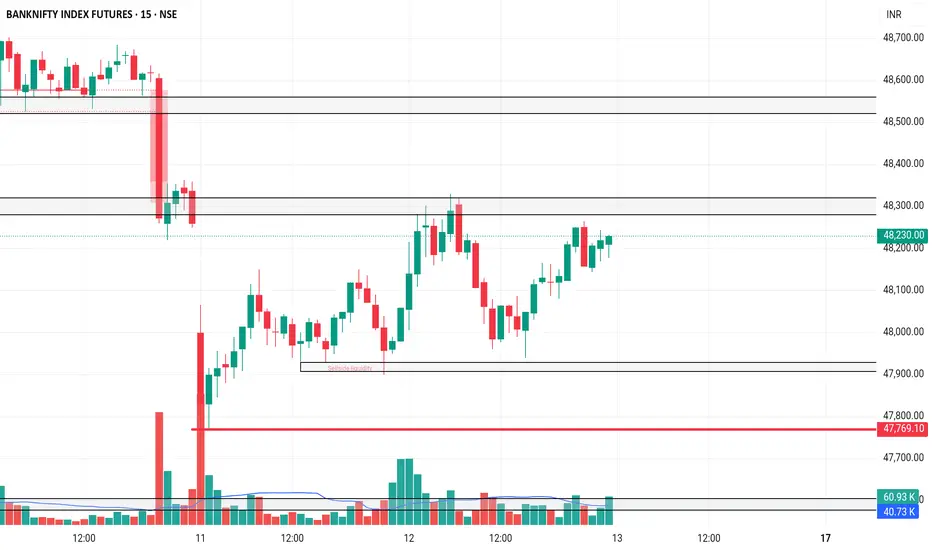
BANKNIFTYBanknifty levels are based on imbalances
1. gapup 48300 long
2. 48300-47900 trade breakout
3. gapdown 47900 short

BANKNIFTYBanknifty levels are based on imbalances
1. gapup 48300 long
2. 48300-47900 trade breakout
3. gapdown 47900 short
BANKNIFTYBanknifty levels are based on imbalances
1. gapup 48150 long
2. 48150-47900 trade bfreakout
3. gapdown 47900 short

BANKNIFTYBanknifty levels are based on imbalances
1. gapup 48550 long
2. 48550-48100 trade breakout
3. gapdown 48100 short

BANKNIFTYBanknifty levels are based on imbalances
1. gapup 49000 long
2. 49000-48550 trade breakout
3. gapdown 48500 short

BANKNIFTYBanknifty levels are based on imbalances
1. gapup 49000 long
2. 49000-48550 trade breakout
3. gapdown 48550 short

BANKNIFTYBanknifty levels are based on imbalances
1. gapup 49000 long
2. 49000-48600 trade breakout
3. gapdown 48600 short
