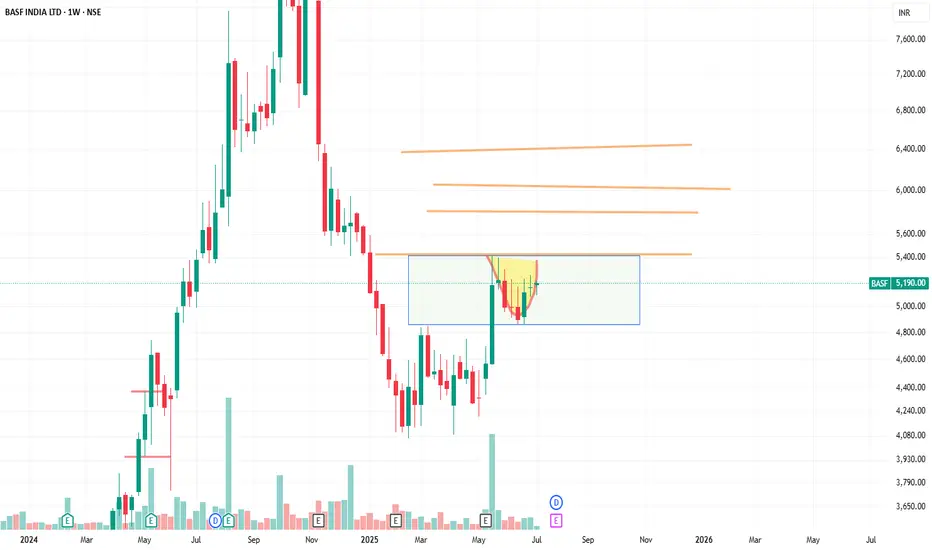
BASF India LtdThe stock has been in a long-term consolidation zone, building strong base structure.
And after a breakout retracement is going on
Now it's showing signs of breaking out with solid volume, signaling potential shift in momentum.
🧱 Base formation = strength
🔥 Volume spike = interest returning
📈 Breakout here could lead to sustained upside if momentum follows through.
Level to watch:
Not financial advice – just sharing my view.
BASF trade ideas
BASF S/RSupport and Resistance Levels:
Support Levels: These are price points (green line/shade) where a downward trend may be halted due to a concentration of buying interest. Imagine them as a safety net where buyers step in, preventing further decline.
Resistance Levels: Conversely, resistance levels (red line/shade) are where upward trends might stall due to increased selling interest. They act like a ceiling where sellers come in to push prices down.
Breakouts:
Bullish Breakout: When the price moves above resistance, it often indicates strong buying interest and the potential for a continued uptrend. Traders may view this as a signal to buy or hold.
Bearish Breakout: When the price falls below support, it can signal strong selling interest and the potential for a continued downtrend. Traders might see this as a cue to sell or avoid buying.
20 EMA (Exponential Moving Average):
Above 20 EMA(50 EMA): If the stock price is above the 20 EMA, it suggests a potential uptrend or bullish momentum.
Below 20 EMA: If the stock price is below the 20 EMA, it indicates a potential downtrend or bearish momentum.
Trendline: A trendline is a straight line drawn on a chart to represent the general direction of a data point set.
Uptrend Line: Drawn by connecting the lows in an upward trend. Indicates that the price is moving higher over time. Acts as a support level, where prices tend to bounce upward.
Downtrend Line: Drawn by connecting the highs in a downward trend. Indicates that the price is moving lower over time. It acts as a resistance level, where prices tend to drop.
RSI: RSI readings greater than the 70 level are overbought territory, and RSI readings lower than the 30 level are considered oversold territory.
Combining RSI with Support and Resistance:
Support Level: This is a price level where a stock tends to find buying interest, preventing it from falling further. If RSI is showing an oversold condition (below 30) and the price is near or at a strong support level, it could be a good buy signal.
Resistance Level: This is a price level where a stock tends to find selling interest, preventing it from rising further. If RSI is showing an overbought condition (above 70) and the price is near or at a strong resistance level, it could be a signal to sell or short the asset.
Disclaimer:
I am not a SEBI registered. The information provided here is for learning purposes only and should not be interpreted as financial advice. Consider the broader market context and consult with a qualified financial advisor before making investment decisions.

ATH breakoutFOR LONGTERM
Good volume build up in daily and weekly timeframe.
ATH breakout with good volume.
Fundamentals are good.
FII stakes are up.
Fib retracement from 0.68 level shows price is long.
NOTE: I do my analysis, do yours before trade.
Eat🍜 Sleep😴 TradingView📈 Repeat 🔁

BASF-TRG 3(5) achievedNegative divergence is being observed in 3rd( 5) wave sell on rise as fast rise seen in perticular wave . exit your longs

BASF LONGBASF
MTF Analysis
BASF Corp Yearly Breakout 7949
BASF Corp 6 Month Demand Breakout 7949
BASF Corp Qtrly Demand BREAKOUT 7949
BASF Corp Monthly Breakout 6345
BASF Corp Weekly bufl 6654
BASF Corp dAILY DMIP 6369
ENTRY 6654
SL 6369
RISK 285
Target 9244
REWARD POINT 2590
Last High 7949
RR 9.09
RR 39%

BASF--CONSOLIDATINGOn breakout of contracting triangle -- 5th wave we have a target of 7950, 8400 and 8900. consolidating before any meaningful trend .

BASF --SELL on rise As inverse head and shoulder in 15 min the stock may go down till 6000-6200 level. and end of A,B,C corrective wave.


BASF India - Diversified Investment**Overview and Key Highlights**
1. **Revenue and Profitability**:
- **Revenue**: BASF India Limited reported a revenue of Rs. 137,674.8 million for the financial year 2023-2024, showing a slight increase from Rs. 136,447.7 million in the previous year.
- **Profit Before Tax**: The company recorded a profit before tax (before exceptional items) of Rs. 7,589.5 million, up from Rs. 5,280.9 million in the previous year.
2. **Dividend**:
- The Board of Directors has recommended a dividend of 150% (Rs. 15 per equity share), an increase from 80% (Rs. 8 per equity share) in the previous year.
3. **Segment Performance**:
- **Agricultural Solutions**: Registered good growth driven by products like Exponus® in insecticides, Priaxor® in fungicides, and Tynzer® in herbicides.
- **Industrial Solutions**: The Dispersions business saw higher volumes despite lower price realizations, while the Performance Chemicals business faced challenging market conditions but improved margins due to lower input costs.
- **Materials Segment**: Performance Materials and Monomers businesses showed significant growth, driven by high demand and new product sales.
- **Surface Technologies**: Coatings business improved marginally, while Catalysts business saw strong volume growth but faced higher input costs.
4. **Sustainability and Environmental Initiatives**:
- BASF India Limited has been focusing on environmental stewardship, achieving REDcert2 Certification for its Dispersion plants and reducing dependence on fossil fuels by procuring renewable energy.
- The company has also launched initiatives like BASF Kids’ Lab and We-Chemie to promote chemistry education and inclusion of women in the chemical industry.
5. **Corporate Governance and Compliance**:
- The company has maintained high standards of corporate governance, complying with all relevant regulations and standards.
- There were no significant qualifications or reservations in the auditors’ reports.
**Financial Ratios and Performance Metrics**
1. **Revenue Growth**:
- The revenue growth rate is approximately 1.1% year-over-year, indicating stable performance despite global economic uncertainties.
2. **Profit Margin**:
- The profit before tax margin has improved from about 3.9% in the previous year to around 5.5% in the current year, reflecting better cost management and product mix.
3. **Debt and Liquidity**:
- The company had no borrowings as of the end of the financial year 2023-2024, indicating strong liquidity and financial health.
- The debt-to-equity ratio was nil, further highlighting the company’s robust financial position.
4. **Return on Equity (ROE)**:
- Although not explicitly stated, the ROE can be calculated using the profit after tax and shareholders' equity. Given the profit after tax of Rs. 5,633.5 million and shareholders' equity of approximately Rs. 32,235.8 million, the ROE would be around 17.5%, indicating a healthy return on equity.
5. **Cash Flow**:
- The company generated cash from operations of Rs. 8,072.4 million during the year, demonstrating efficient working capital management.
**Core Business and Strategic Initiatives**
1. **Product Diversification**:
- BASF India Limited operates across various segments including Agricultural Solutions, Industrial Solutions, Materials, Surface Technologies, and Nutrition & Care. This diversification helps in mitigating risks and capitalizing on growth opportunities across different markets.
2. **Innovation and R&D**:
- The company has been investing in research and development, evident from the launch of new products like Efficon® Insecticide and the expansion of its Polyurethane Technical Development Center in Mumbai.
3. **Sustainability and ESG**:
- BASF India Limited has been proactive in sustainability initiatives, aiming to reduce its carbon footprint and promote environmental stewardship. The company has set targets to reduce its absolute CO2 emissions and achieve net zero greenhouse gas emissions by 2050.
4. **Corporate Social Responsibility (CSR)**:
- The company has a robust CSR policy focusing on areas such as Water, Sanitation, and Hygiene (WASH), Education, and Skill Development. It has spent Rs. 119 million on CSR activities during the financial year 2023-2024.
**Risk Management and Compliance**
1. **Risk Assessment**:
- The company has a mechanism for risk assessment and minimization, with regular reviews to ensure that risks are identified and controlled effectively.
2. **Compliance**:
- BASF India Limited has been compliant with all statutory requirements and has not faced any significant material orders from regulators or courts that could impact its operations.
3. **Internal Financial Controls**:
- The company has robust internal financial control systems in place, ensuring the orderly conduct of its business and safeguarding its assets.
Price Trends and Patterns
Key Support and Resistance Levels:
Support Levels: The chart shows several horizontal lines indicating key support levels. These levels acted as a floor, preventing the stock from falling further during pullbacks. Notable support levels were observed around 6,000 and 5,500.
Resistance Levels: Similarly, resistance levels acted as a ceiling, capping the stock’s upward movement. Key resistance levels were identified around 7,000 and 8,000.
Green Lines as Support:
The green lines drawn in the middle of long candlesticks have played a crucial role as support levels. These lines have consistently acted as a strong foundation, allowing the price to bounce back whenever it approached these levels.
Candlestick Patterns:
Bullish Patterns: Throughout the uptrend phases, we observed bullish candlestick patterns such as the hammer and bullish engulfing, signaling potential buying opportunities.
Bearish Patterns: During the correction phases, bearish patterns like the shooting star and bearish engulfing indicated potential selling pressure.
Volume Analysis
Trading volume is a critical component of price action analysis. The volume bars at the bottom of the chart provide insights into the strength of price movements:
High Volume on Uptrends: During the uptrend phases, we noticed increased trading volume, confirming the strength of the bullish moves. High volume on up days suggests strong investor interest and confidence.
Volume Spikes on Breakouts: Significant volume spikes were observed during breakout attempts above resistance levels. These spikes indicate strong buying interest, often leading to sustained upward movements.
**Conclusion**
BASF India Limited has demonstrated strong financial performance and operational resilience in the face of global economic uncertainties. The company's focus on sustainability, innovation, and corporate governance positions it well for long-term growth and profitability. Investors looking for a stable and socially responsible investment opportunity may find BASF India Limited an attractive option.
**Investment Considerations**
1. **Stable Financial Performance**: The company's consistent revenue growth and improved profitability make it a stable investment option.
2. **Sustainability Initiatives**: BASF India Limited's commitment to environmental stewardship and social responsibility aligns with the growing trend of ESG investing.
3. **Innovation and R&D**: The company's investment in research and development ensures a pipeline of new products and technologies, driving future growth.
4. **Robust Corporate Governance**: The company's adherence to high standards of corporate governance provides assurance of ethical and transparent business practices.
However, investors should also consider the following:
1. **Market Risks**: The company's performance can be affected by global economic conditions, geopolitical tensions, and market volatility.
2. **Regulatory Risks**: Changes in regulations, particularly those related to environmental and safety standards, could impact the company's operations and costs.
3. **Competition**: The chemical industry is highly competitive, and the company must continually innovate and improve its products to maintain market share.
Overall, BASF India Limited presents a compelling investment case for those seeking a stable, innovative, and socially responsible company with strong financial fundamentals.

BUY TODAY SELL TOMORROW for 5%DON’T HAVE TIME TO MANAGE YOUR TRADES?
- Take BTST trades at 3:25 pm every day
- Try to exit by taking 4-7% profit of each trade
- SL can also be maintained as closing below the low of the breakout candle
Now, why do I prefer BTST over swing trades? The primary reason is that I have observed that 90% of the stocks give most of the movement in just 1-2 days and the rest of the time they either consolidate or fall
Trendline Breakout in BASF
BUY TODAY SELL TOMORROW for 5%

BASF; now i can't unsee it!It was just a Flag breakout, until I drew the curved-trendline; now i can't unsee it!

BASF - An Investment pick with more than 70% ROI.The stock has been in an up trend.
It has broken its all time high in 2021 and in good consolidation for 2 years and broken out of consolidation now.
It has broken out of a bullish flag and pole pattern / falling channel pattern in a 3 M timeframe.
One may also consider this for a swing opportunity , RSI intact in all time frames.
Weekly price action shows, that the stock has broken out of falling channel, retested and reversed Consolidated for 7 weeks. Weekly RSI took support at 60 and bounced. Looks ready for a swing. SL - Previous week low at 3155. Target 1 - all time high, 3880.

BASF--BUY the dipsBASF --30 MIN in corrective mode it might perk up to 6000-6050 level. Present correction to last till 5540-5580 . Stops for longs 5400 . This chemical stock to give good quarterly result expected . 1 TO 2 yearly trg above 7500 as inverse head and shoulder formation in monthly chart.

BASF --sell on riseBASF-- at major trendline resistance and completion of impulsive 5th wave .Sell and buy near to 4980 . monthly chart shows inverse head and shoulder formation in progress and a target of 7500 approx ( 2 year target)

BASF--sell on riseafter completing 5 wave on upside .We find trendline support at 4980 and wave a might end here till then in a channel sell on upper boundries of channel in 5 min chart

BASF IndiaBASF INDIA long channel BO
It is retesting the trendline
so the SL is low at ~2900 for the targets of 3500 and 3900.

BASFBASF INDIA has breakout 3 years resistance level and retest that level so further up move will come TGT upto 6439 SL bellow 4320
this is only for educational purpose

BASF--BOOK PROFITtrendline resistance and target of 5th wave near to 4950 book your profit and wait for correction.

BASFNear to short term target of 4800-4910 .. After one more correction the stock is to be bought into near to 4200 level for a long term target of 7100. As it has been long since company has declared bonus and moreover company earning are to grow in leap and bound.

lapu star breakoutScreener for stocks trading at unusually high volume versus their historical average today

BASF-SELLAfter topping at 4325 approx and end of 3rd wave script is making lower high and lower low . In 4th wave script is likely to bottom out at 3800-3850 wait for another 30- 60 days to buy this script again.

BASF-SELLafter completing 3rd wave share making lower high and lower low . presently in a.b.c wave expected price on correction og 4th wave lasting about 2 months price of 3800-3850 would be a good price to enter.

BASF--selltarget of basf achieved of 3rd wave and trendline resistance also. sell near to 4340 and make merry as stock was earlier recommended at 1600 rs for a long trg of 4200 approx.
