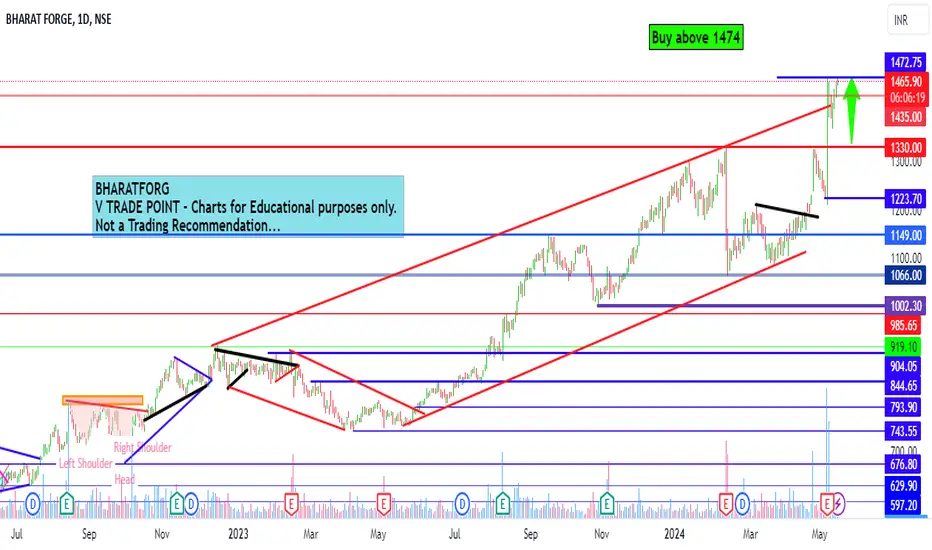
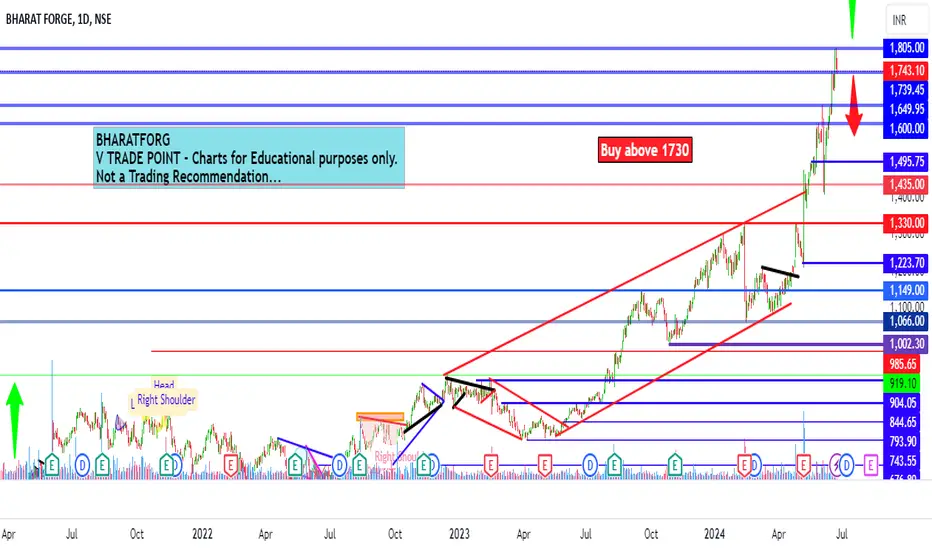
Bharat Forge Ltd intraday level for 1st Aug #BHARATFORG Bharat Forge Ltd intraday level for 1st Aug #BHARATFORG
Buying may witness above 1753
Support area 1727-1731. Below ignoring buying momentum for intraday
Charts for Educational purposes only.
Please follow strict stop loss and risk reward if you follow the level.
Thanks,
V Trade Point
BHARATFORG trade ideas
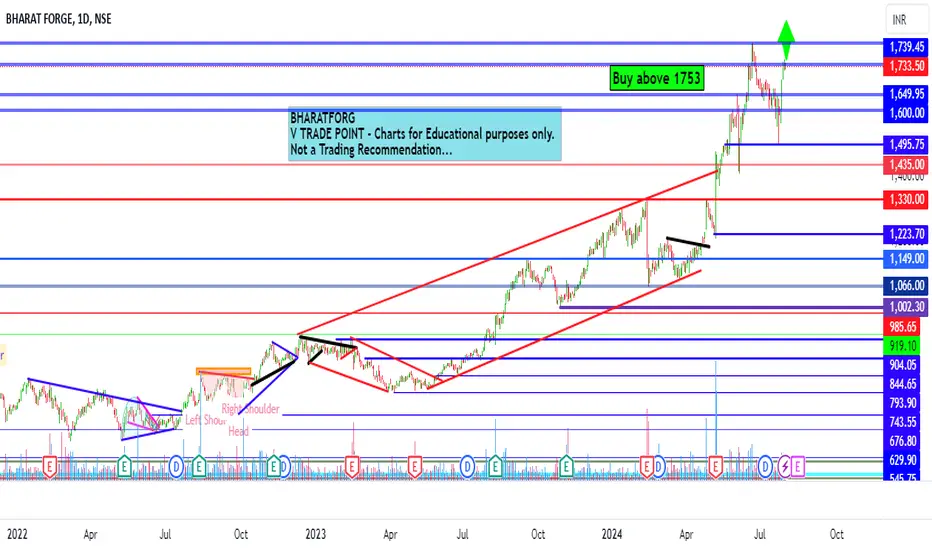
Bharat Forge Ltd ntraday level for 31st July #ForgBharat Forge Ltd ntraday level for 31st July #Forg
Buying may witness above 1753
Support area 1740. Below ignoring buying momentum for intraday
Charts for Educational purposes only.
Please follow strict stop loss and risk reward if you follow the level.
Thanks,
V Trade Point
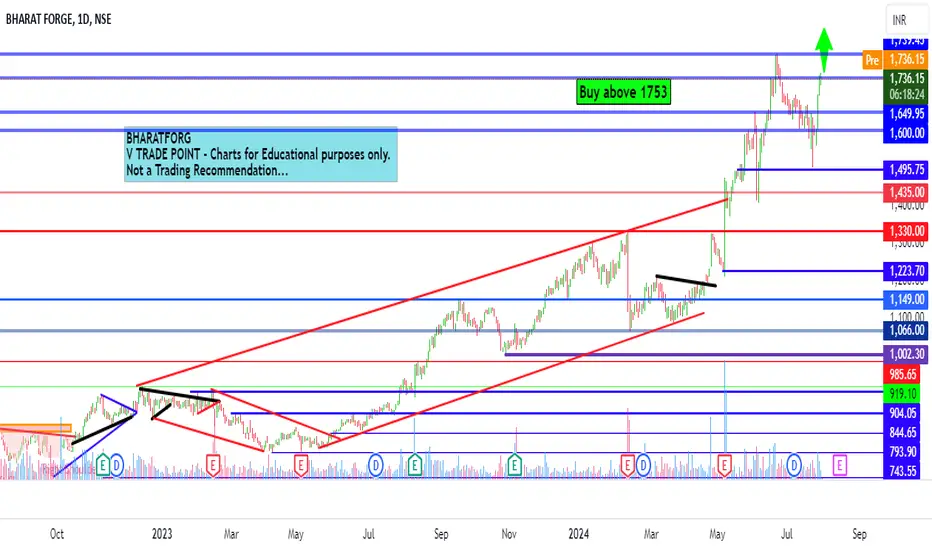
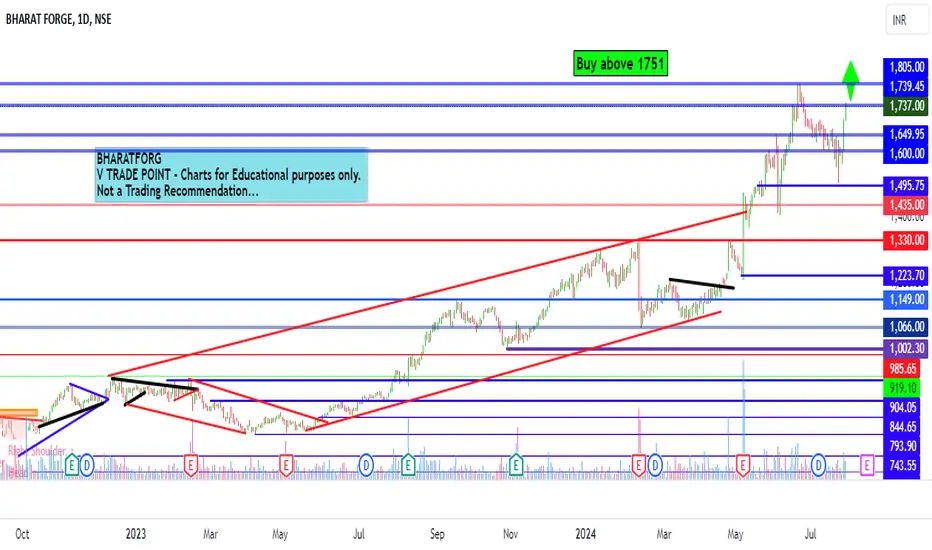
Bharat Forg Intraday level for 30th July #BHARATFORG Bharat Forg Intraday level for 30th July #BHARATFORG
Buying may witness above 1751
Support area 1720. Below ignoring buying momentum for intraday
Charts for Educational purposes only.
Please follow strict stop loss and risk reward if you follow the level.
Thanks,
V Trade Point
bharat forge bullishafter hits my few days old prediction, now bharat forge retest the breakout, abd ready to bull again sl 1530, target open

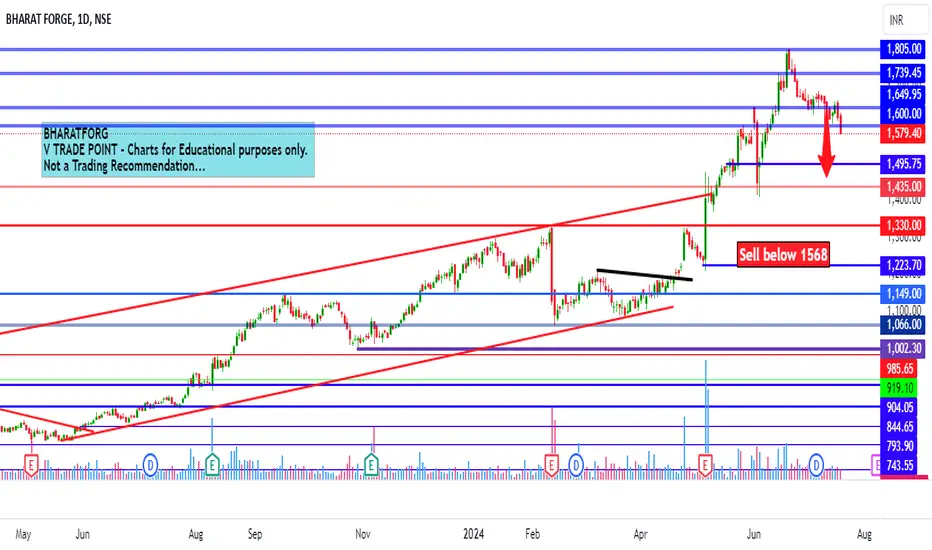
Bharatforg Intraday level for 22nd July #BHARATFORG Bharatforg Intraday level for 22nd July #BHARATFORG
Selling may witness above 1568
Support area 1580. Below ignoring selling momentum
Charts for Educational purposes only.
Please follow strict stop loss and risk reward if you follow the level.
Thanks,
V Trade Point
bflafter hits my old arrow tgt, now bfl ready to hiy new tgt 1685, 1800 in early august mnth, sl is 1600

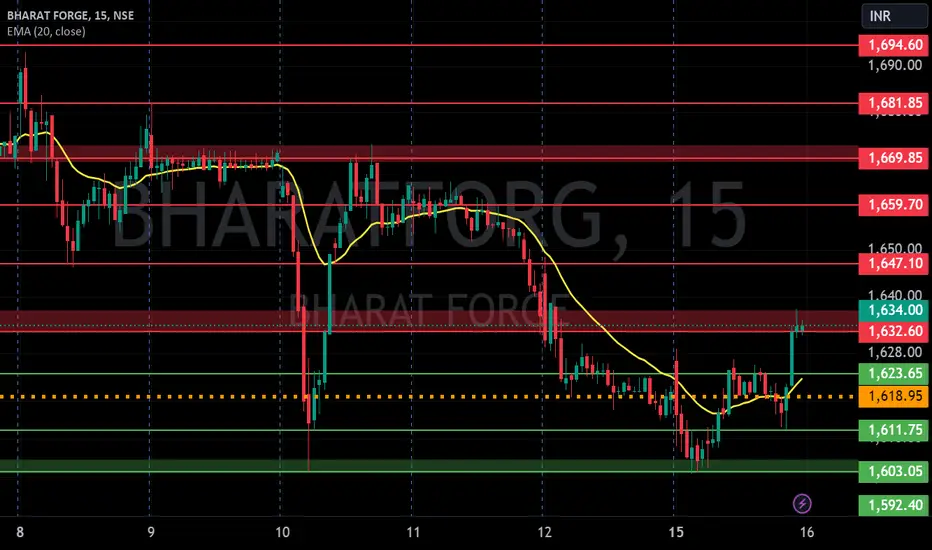
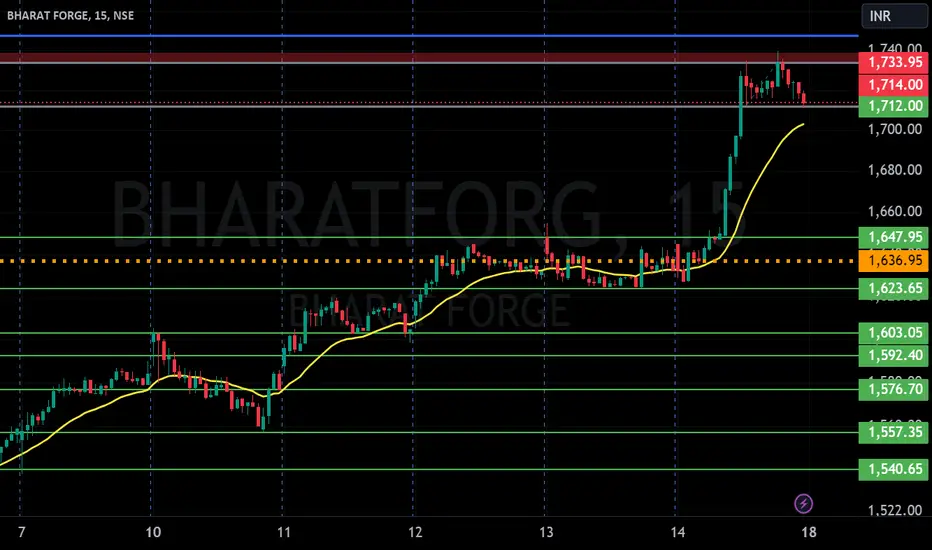
BHARAT FORGE S/R for 16/7/24Support and Resistance Levels: In technical analysis, support and resistance levels are significant price levels where buying or selling interest tends to be strong. They are identified based on previous price levels where the price has shown a tendency to reverse or find support.
Support levels are represented by the green line and green shade, indicating areas where buying interest may emerge to prevent further price decline.
Resistance levels are represented by the red line and red shade, indicating areas where selling pressure may arise to prevent further price increases. Traders often consider these levels as potential buying or selling opportunities.
Breakouts: Breakouts occur when the price convincingly moves above a resistance level (red shade) or below a support level (green shade). A bullish breakout above resistance suggests the potential for further price increases, while a bearish breakout below support suggests the potential for further price declines. Traders pay attention to these breakout signals as they may indicate the start of a new trend or significant price movement.
20 EMA: The yellow line denotes 20 EMA, to interpret the 20 EMA, you need to compare it with the prevailing stock price. If the stock price is below the 20 EMA, it signals a possible downtrend. But if the stock price is above the 20 EMA, it signals a possible uptrend.
Disclosure: I am not SEBI registered. The information provided here is for learning purposes only and should not be interpreted as financial advice. It is important to consult with a qualified financial advisor before making any investment decisions. Tweets neither advice nor endorsement.
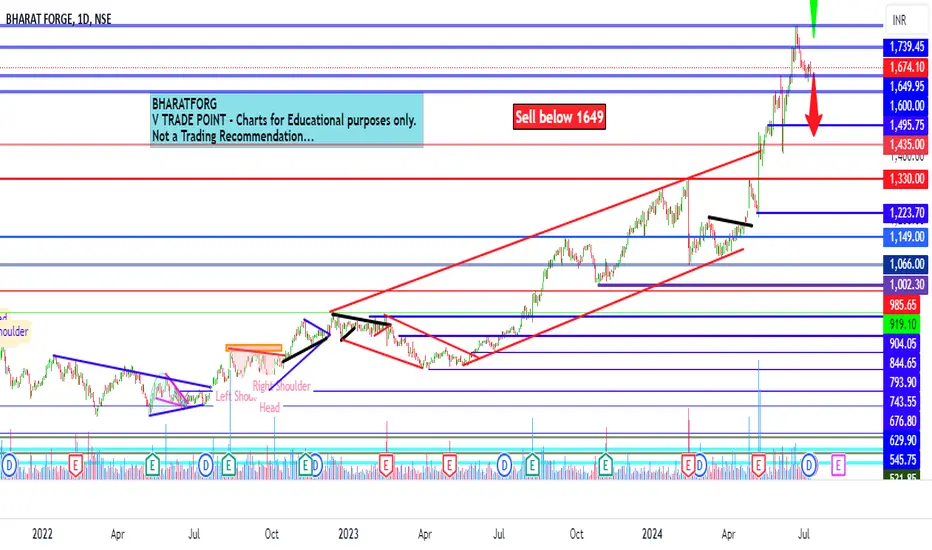
Bharatforg Intraday level for 9th July #BHARATFORG Bharatforg Intraday level for 9th July #BHARATFORG
Selling opportunity above 1649
Resistance area 1675-1680. Above ignoring selling opportunity
Charts for Educational purposes only.
Please follow strict stop loss and risk reward if you follow the level.
Thanks,
V Trade Point
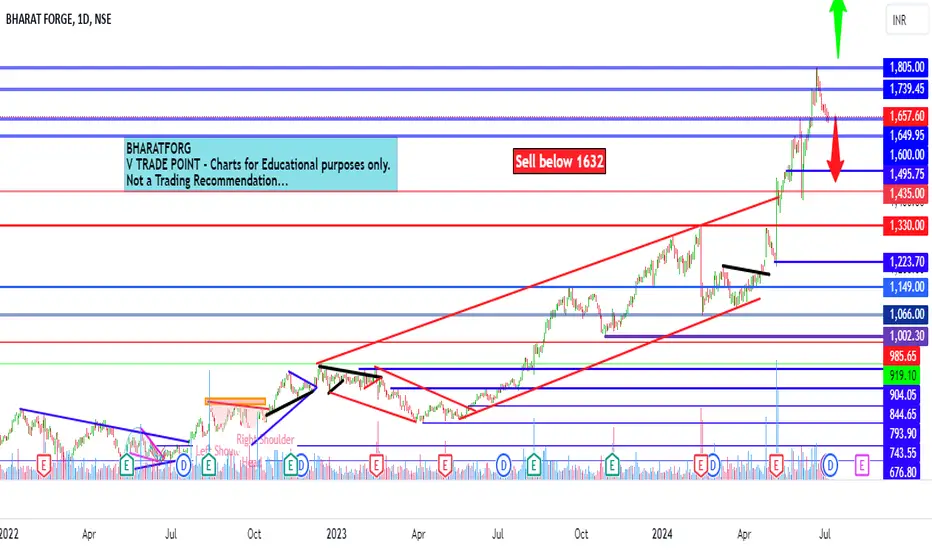
Bharat Forg Intraday level for 4th July #BHARATFORG Bharat Forg Intraday level for 4th July #BHARATFORG
Selling opportunity below 1632
Stop Loss area 1650
Charts for Educational purposes only.
Please follow strict stop loss and risk reward if you follow the level.
Thanks,
V Trade Point
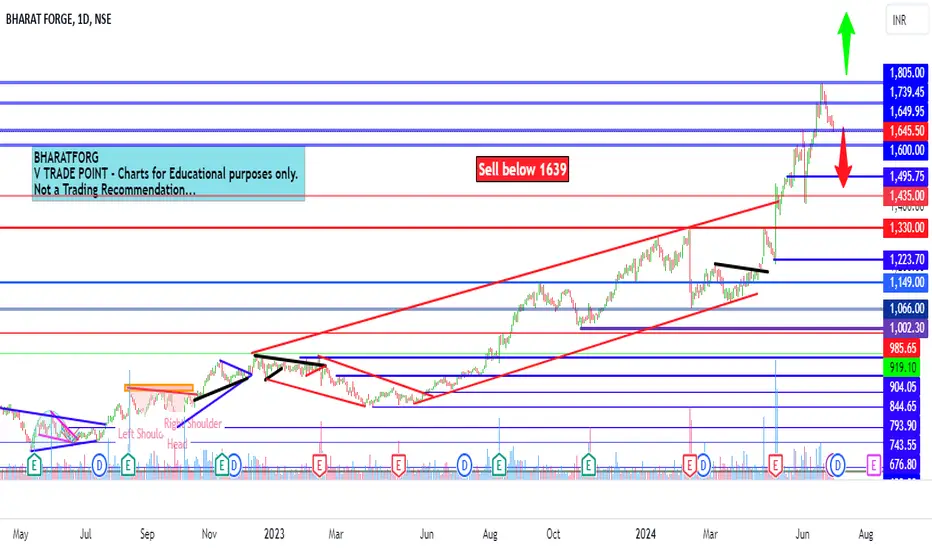
Bharat Forg Intraday level for 3rd July #BHARATFORG Bharat Forg Intraday level for 3rd July #BHARATFORG
Selling opportunity below 1639
Stop Loss area 1655
Charts for Educational purposes only.
Please follow strict stop loss and risk reward if you follow the level.
Thanks,
V Trade Point
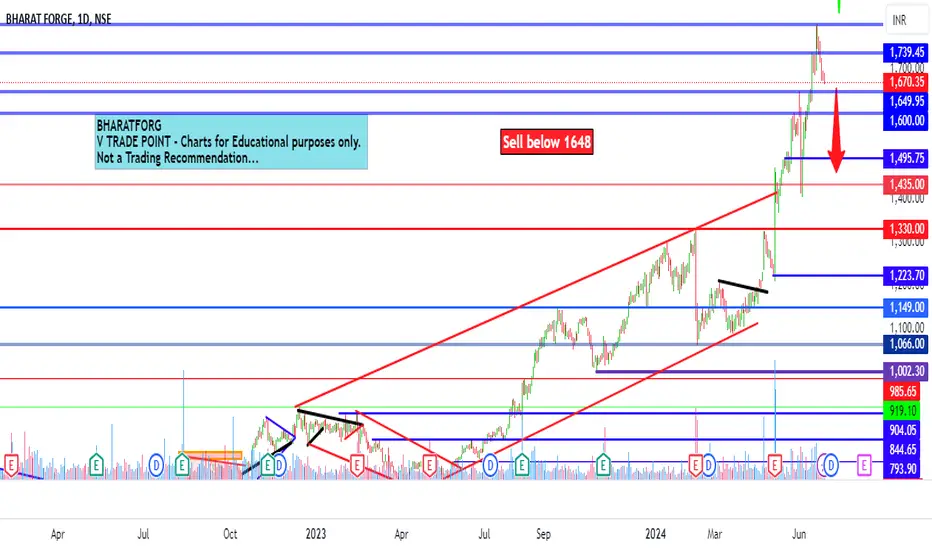
Bharatforg Intraday level for 2nd July #BHARATFORGBharatforg Intraday level for 2nd July #BHARATFORG
Selling opportunity below 1648
Stop Loss area 1665
Charts for Educational purposes only.
Please follow strict stop loss and risk reward if you follow the level.
Thanks,
V Trade Point
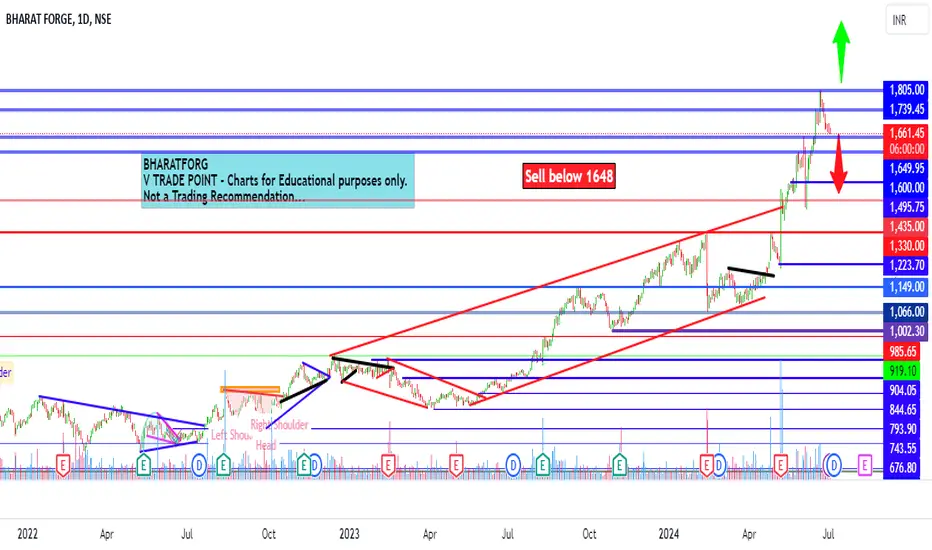
Bharatforg Intraday level for 1st July #BHARATFORG Bharatforg Intraday level for 1st July #BHARATFORG
Selling opportunity below 1648
Stop Loss area 1665
Charts for Educational purposes only.
Please follow strict stop loss and risk reward if you follow the level.
Thanks,
V Trade Point
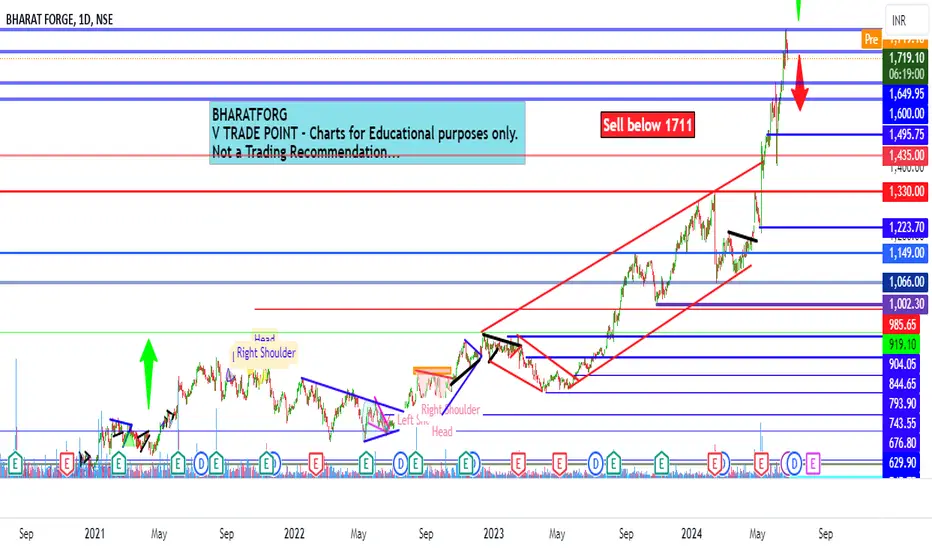
BHARATFORG Intraday level fo 26th June #BHARATFORG BHARATFORG Intraday level fo 26th June #BHARATFORG
Selling opportunity below 1711
Stop Loss area 1735
Charts for Educational purposes only.
Please follow strict stop loss and risk reward if you follow the level.
Thanks,
V Trade Point
Bharatforg Intraday level fo 25th June #BHARATFORG Bharatforg Intraday level fo 25th June #BHARATFORG
Selling opportunity below 1730
Stop Loss area 1755
Charts for Educational purposes only.
Please follow strict stop loss and risk reward if you follow the level.
Thanks,
V Trade Point
BHARATH FORGE S/RSupport and Resistance Levels: In technical analysis, support and resistance levels are significant price levels where buying or selling interest tends to be strong. They are identified based on previous price levels where the price has shown a tendency to reverse or find support.
Support levels are represented by the green line and green shade, indicating areas where buying interest may emerge to prevent further price decline.
Resistance levels are represented by the red line and red shade, indicating areas where selling pressure may arise to prevent further price increases. Traders often consider these levels as potential buying or selling opportunities.
Breakouts: Breakouts occur when the price convincingly moves above a resistance level (red shade) or below a support level (green shade). A bullish breakout above resistance suggests the potential for further price increases, while a bearish breakout below support suggests the potential for further price declines. Traders pay attention to these breakout signals as they may indicate the start of a new trend or significant price movement.
Disclosure: I am not SEBI registered. The information provided here is for learning purposes only and should not be interpreted as financial advice. It is important to consult with a qualified financial advisor before making any investment decisions. Tweets neither advice nor endorsement.

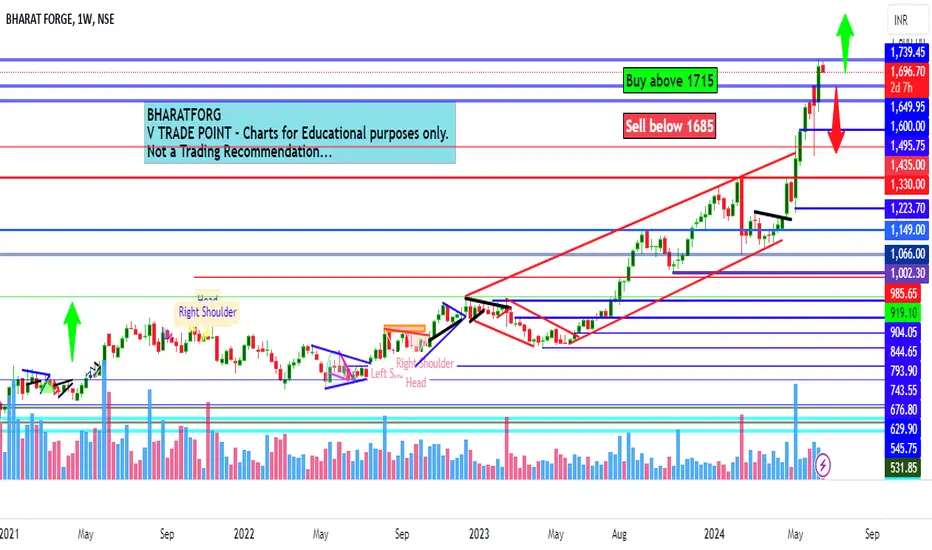
BHARAT FORG Intraday level for 19th June #BHARATFORG BHARAT FORG Intraday level for 19th June #BHARATFORG
Buying opportunity above 1715
Stop Loss area 1700
Selling opportunity below 1685
Stop Loss area 1700
Charts for Educational purposes only.
Please follow strict stop loss and risk reward if you follow the level.
Thanks,
V Trade Point
BHARAT FORGE S/R Support and Resistance Levels: In technical analysis, support and resistance levels are significant price levels where buying or selling interest tends to be strong. They are identified based on previous price levels where the price has shown a tendency to reverse or find support.
Support levels are represented by the green line and green shade, indicating areas where buying interest may emerge to prevent further price decline.
Resistance levels are represented by the red line and red shade, indicating areas where selling pressure may arise to prevent further price increases. Traders often consider these levels as potential buying or selling opportunities.
Breakouts: Breakouts occur when the price convincingly moves above a resistance level (red shade) or below a support level (green shade). A bullish breakout above resistance suggests the potential for further price increases, while a bearish breakout below support suggests the potential for further price declines. Traders pay attention to these breakout signals as they may indicate the start of a new trend or significant price movement.
Disclosure: I am not SEBI registered. The information provided here is for learning purposes only and should not be interpreted as financial advice. It is important to consult with a qualified financial advisor before making any investment decisions. Tweets neither advice nor endorsement.
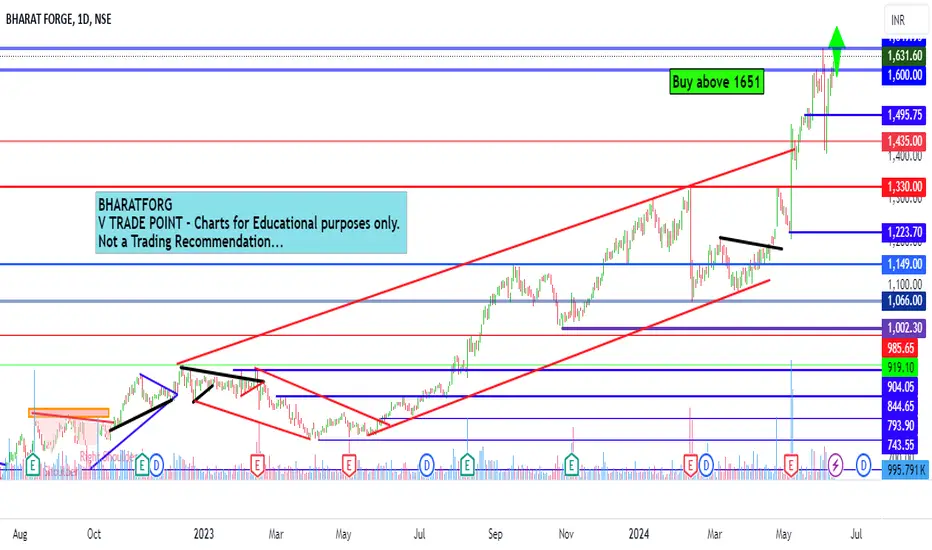
Bharatforg Intraday level fo 14th June #BHARATFORG Bharatforg Intraday level fo 14th June #BHARATFORG
Buying opportunity above 1651
Stop Loss area 1630
Charts for Educational purposes only.
Please follow strict stop loss and risk reward if you follow the level.
Thanks,
V Trade Point
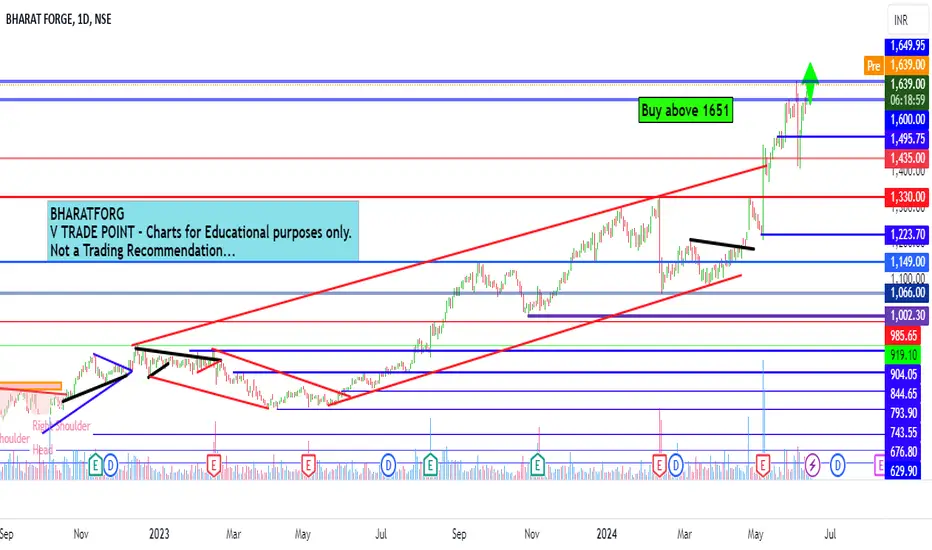
BHARAT FORG LTD Intraday level fo 13th June #BHARATFORG BHARAT FORG LTD Intraday level fo 13th June #BHARATFORG
Buying opportunity above 1651
Stop Loss area 1630
Charts for Educational purposes only.
Please follow strict stop loss and risk reward if you follow the level.
Thanks,
V Trade Point
Level for Bharat forg for 31st MayIntraday level for Bharat forg for 31st May
#BHARATFORG
Buying opportunity above 1600
Support area around 1575
Selling opportunity for intraday below 1538
Resistance and Stop Loss area around 1550
Charts for Educational purposes only.
Please follow strict Risk Reward and Stop Loss if you follow the levels.
Thanks,
V Trade Point

Bharat Forge trade ideaFrom the Chart, you can see first the bhargat forge broke the TL with such good volumes.
It consolidated for few days and gave another breakout.
Wait for the stock to retrace/pullback for entry.

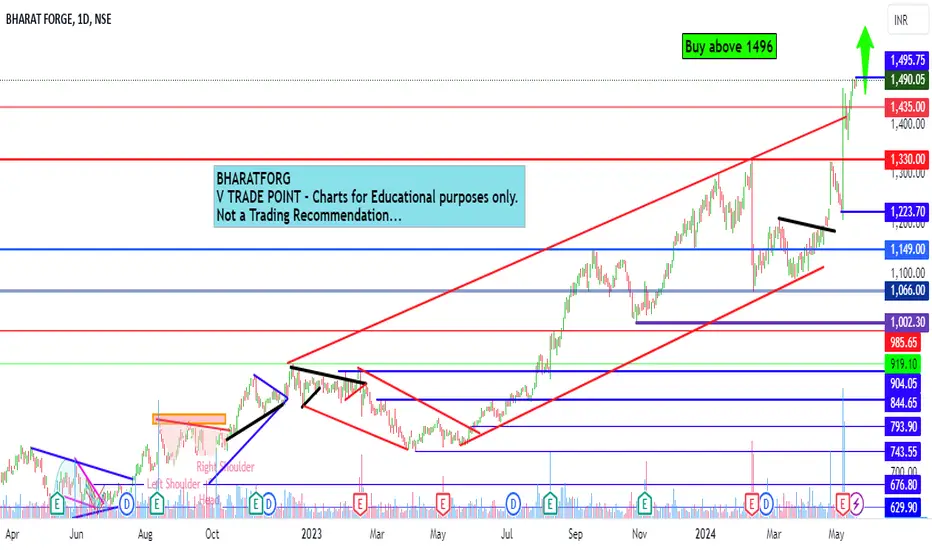
Intraday view BHARATFORG for tomorrow 21st MayIntraday view BHARATFORG for tomorrow 21st May
Expecting buying opportunity above 1496
Follow strict risk reward and stop loss
Charts for Educational purposes only.
Thanks,
V Trade Poin
Intraday view for Bharat ForgIntraday view for Bharat Forg
Buy view above 1318
Charts for Educational purposes only. Not a trading recommendation.
Follow strict risk reward and stop loss.
Thanks,
V Trade Point