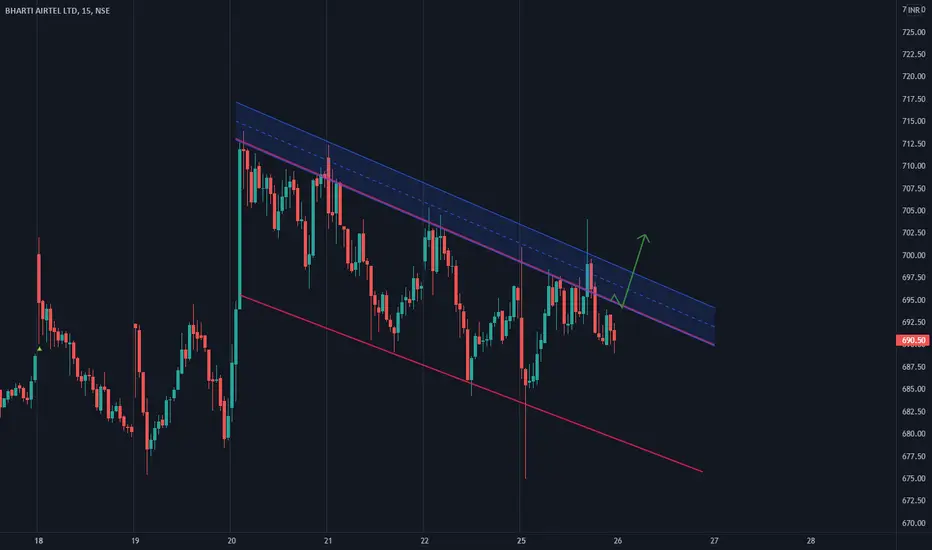
Bharati airtel buy for intraday tradeBharati airtel buy for intraday trade if stock have volume on 15 min timeframe
BHARTIARTL trade ideas

OpportunityDue to the market oress8, we are again getting Airtel close to its support line.
Time to accumulate.
Good luck!!

airtelstrong closing above 710,Airtel - India's largest telecom service provider for customer & business. Buy postpaid, broadband plans in India. Online recharge prepaid & dth through ...

Bharati airtel buy for intradaybharati airtel makes a lower low formation if stock break the downtrend line then we will buy stock for day trading
BHARTIARTL : Looking positive BHARTIARTL
- Trading in same range since 15-19 days
- Not breaking support
-Good R:R
Like, Share, Comment for regular updates.
Disclaimer
I am not sebi registered analyst
My studies are Educational purpose only
Please consult with your Financial advisor before trading or investing

BhartiAirtel Entry, SL & TargetBig moment in 15mins Time frame Market... Please wait for result and share your comment

BHARTIARTL - BullishNSE:BHARTIARTL is forming Bat harmonic pattern with PRZ level at 743.10. Volume is also significantly higher compared to past 9 days. Price crossed point B level today so the pattern got activated. It it sustains this level, One can play uptrend till PRZ level is hit or One can wait till PRZ is hit and play reversal.

Bharti Airtel may test its 50% retracement levels on Fibo..Bharti Airtel may test its 50% Fibonacci retracement levels at 630-635, once it breaks 670-667 support zone...


BHARATI AIRTEL LONG Bharti Airtel long for 18 OCT 2021 If Stock Show Momentum Then We Will Long stock and HOLD For DOWNTREND Trendline

Trangle Pattern ready for breakout-Bharti Airtelas in daily chart bharti airtel almost completed trangle and now ready for breakout. Also it is ready to take support from 44 Moving average as from last many trading session it has taken support on 44 Moving average.

BHARATI AIRTEL 26-9-21Airtel which gave a big up-move in the recent past is all set for another 10% gain as it has broken the near term resistance of 735 and has tested it successfully. Trading with a strict stop-loss is recommended.
Ps : For educational purposes only.

BHARTIARTL on daily chart showing sign of trend reversalNSE:BHARTIARTL
After a good profit booking started from 24th of September BHARTIARTL did show good selling until its come to the support level of 673. near 673 on 1st and 4th of October we did see that selling is now dried out as candles did not managing to close near their lows. And tails we are seeing on both of the candles the are good signs for presence of demand in BHARTIARTL.
Now if you see todays candle its looks quite bullish it has a good range and strong closing shows us good bullish signs and is a good confirmation for our above view. From here onwards if BHARTIARTL manages to close above 710 then we can consider it bullish for swing trade with expected target of 800, we can maintain our stop loss below 670. :) :) :)
|| Hari OM ||
|| Shree Ram ||
|| ambdnya ||

Bharti Airtel - Important LevelBharti Airtel - Important Level 50% FIB Level Support Level and Inside Candle Break Out Looking for a buy in coming days.

BHARTI AIRTEL - Divergence assisted reversal of polarity.
We have a divergence with RSI on daily TF.
Good entry point.
View negated below 50EMA Close.

bharti artl ready to flyBHARTI ARTL : TIME FRAME : 15 min
very good for swing from this level . wait for a positive closing to go long on this stock .
2) retracement done in the stock .
3) big move expected .

BHARTIARTL SHORTThe indicators used on this chart suggests that BHARTIARTL will probably reverse after a strong bullish movement.
- MACD gives us a short signal
- ADX is 45.59 and after period of extended uptrend it seems that it curved down what may suggest a trend reversal which we can observe with current price action
We should wait for the price to break the support and retest it as resistance. Therefore the rejection at the resistance will be our entry price.
no financial advice


BHARTI AIRTEL as on 05.09.2021!!ASCENDING TRIANGLE PATTERN FORMED!!
BREAKOUT DONE !!!
CAN MAKE A PULL BACK AT MONTHLY DEMAND AND SUPPLY LEVEL!!
A good move after pullback can make a new high there is a good support at 654 and retracing at that point again do check that in 15 min chart!!
If for intraday can make down gap opening and retrace and move little down but cant say actual as 654 is giving a major support !!!
HIGHER PROBABILITY OF MOVING UP AS BREAKOUT CAME AFTER A YEAR!!!
TARGET=755/800
STOP LOSS=590/580
WEEKLY CHART SHOWING SAME!!
50 AND 200 EMA GIVING GOOD SUPPORT!!
FOR INTRADAY Check daily basis demand and supply AND CAN MAKE A GOOD SHORT TRADE OPTION DO CHECK 15 MIN CHART AND DO TAKE HELP OF PIVOT POINTS!!!
(The above analysis is only for study purpose do not take it as any buy or sell call)

Airtel Chart 23-09-2021 1 Hr Time FrameAirtel is forming a rising wedge i.e a bearish pattern. Need to monitor the upper & lower trend lines to look for a breakout.

BHARTIARTL BreakoutBHARTI AIRTEL LTD made a new ATH on Friday
Last month price made a breakout attempt but it was a fake breakout
200 DMA holding dips
Big breakout candles, consolidation, and now on the move again
Target remains 850~

BHARTI AIRTELChannel b/o.
SL: Lower time frame (daily) swing.
Tip: If the trend continues, ride as long as 20dma holds on daily frame.

Bharti Airtel : Rally won’t stop.Bharti Airtel looking very bullish for 700, 742 and 800 as next targets.
