BHEL can give a multi bagger stock?buy BHEL around 36 levels for target 45, 60
Long term it will be multi bagger
BHEL trade ideas


Bhel Long target of 47+We are not SEBI registered Profit loss is yours..
We are here just present our view on maket and stocks.....

BHEL : 31 AUG 20 :WHAT ARE THE OPPORTUNITIES HERE?
SEE ALL MY PUBLICATIONS, IF IT SEEMS TO BE THE PROFIT RAINING THEN ONLY LIKE AND SHARE WITH YOUR NEAR AND DEARS.
1. DAILY HIGH IS AT UPPER B BAND.
2. BEAUTIFUL TRIANGLE FORMATION.
3. HIGH VOLATILITY IN LAST TRADING DAY.
4. 42 IS THE MAIN RESISTANCE AREA FOR DAILY CHART.
5. SELL BELOW 41.5 IS A JACKPOT.
MY SINCERE THANKS TO MY GURUS TRADING PANTHULU AND NAYAN POKARKAR

BHEL Cup & HandleBHEL forms consecutive 2 series of Cup & Handle patterns with neckline of 42.5 & 44.5 respectively.
So once neckline of 42.5 is broken with high volumes, Target1 of 47, Target2 of 59 & Target3 of 71 should be sought.

BHEL ::: LONGDATE: 30 AUG 2020
INSTRUMENT: BHEL
TIME FRAME: WEEK
FOR CONFIRMATION: DAY
INDICATORS USED:
PARABOLIC SAR: BELOW CANDLE - CONFIRMING BULLISH TREND
STOCHASTICS: FAST LINE CUTTING FROM BELOW - CONFIRMING BULLISH TREND
ICHIMIKO: PRICE ABOVE TENKAN SEN AND CLOSED CROSSING SPAN A - CONFIRMING SLOW UP MOVE FOR A TARGET OF 54.
RISK DISCLOSURE :
Technical analysis of FOREX and INDIAN MARKETS. We are not SEBI REGISTERED ANALYSTS The views expressed here are for our record purposes only. Please consult your personal financial advisor before investing. We are in no way responsible for your profits/losses what so ever.


Multi bagger BHEL CUP & HANDLE BREAKOUT Target 65 levelsBHEL Super Bullish & Cup & Handle Pattern Breakout
Can be bought at CMP levels or above 44 for Safe Players for Short term
Target 65 to 68
Stop Loss 34 on Closing Basis


BHELBHEL is forming a pennant, with low volumes, on break out should give the following target
Target 1 - 42
Ambitious Target - 47
SL- Below the lower trend line or resistance on breakout.
Disclaimer
These trading ideas, please do more technical analysis and enter at you own risks.

breakout of 20 Day flat movementEMA 50 Bounce
Breakout of 20 day resistance
Volume spotted
I will try for a short tf entry.

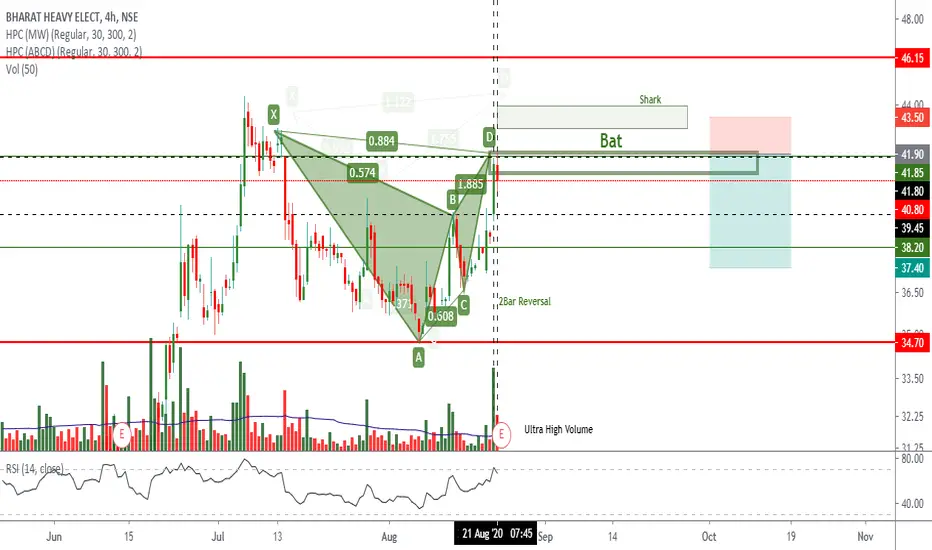
BHEL 4HRBearish BAT
Red lines r Daily Resistance & Support, Green Lines r 4hr Resistnce & Support..
Horizontal BLACK DOTTED lines r High & Low of ULTRA HIGH Volume CANDLE .Vertical dotted line is ULTRA HIGH VOLUME i.e SMART MONEY
ULTRA HIGH VOLUME for going SHORT we need LOW VOLUMES in the area of ULTRA HIGH VOLUME BAR. as High volume shows interest to the upside from “Smart Money” so prices may go higher.
IF Price breaks ULTRA HIGH VOLUME Candle LOW with LOW VOLUMES & with NO DEMAND l.e place for short
POTENTIAL SELL
BHEL 45MNTwo Strong BEARISH Patterns BAT & AB=CD Forming Strong POTENTIAL REVERSAL ZONE
Horizontal BLACK DOTTED lines r High & Low of ULTRA HIGH Volume CANDLE .Vertical dotted line is ULTRA HIGH VOLUME i.e SMART MONEY
ULTRA HIGH VOLUME for going SHORT we need LOW VOLUMES in the area of ULTRA HIGH VOLUME BAR. as High volume shows interest to the upside from “Smart Money” so prices may go higher.
SET UP BECOMES VALID ONLY when Price breaks ULTRA HIGH VOLUME Candle LOW with LOW VOLUMES & with NO DEMAND l.e place for short
POTENTIAL SELL

BHEL 1HRTwo Strong BEARISH Patterns BAT & AB=CD Forming Strong POTENTIAL REVERSAL ZONE
Horizontal BLACK DOTTED lines r High & Low of ULTRA HIGH Volume CANDLE .Vertical dotted line is ULTRA HIGH VOLUME i.e SMART MONEY
ULTRA HIGH VOLUME for going SHORT we need LOW VOLUMES in the area of ULTRA HIGH VOLUME BAR. as High volume shows interest to the upside from “Smart Money” so prices may go higher.
SET UP BECOMES VALID ONLY when RSI s below 70 and IF Price breaks ULTRA HIGH VOLUME Candle LOW with LOW VOLUMES & with NO DEMAND l.e place for short
POTENTIAL SELL

BHELNSE:BHEL
THIS LOOKS PROMISING TO GIVE A MOVE, THE OI CHAIN LOOKS GOOD.
IT CAN BE ENTERED WITH STOP LOSS OF 40, AND CONSERVATIVE ONES CAN OPT FOR 40.50
THE UPMOVE CAN BE SEEN TO 41.50, 43 AND 44.50
KEEP TRAILING THE STOP LOSSES
**********************************************************************************************************************************************
Hi all,
Its pleasure to have you all here.
I have started putting these charts as a contribution from my side to all people who are new to business, as I had to struggle a lot without any sources at disposal. So please consider this a just small contribution from my side.
Few Honest Disclosures:
1. Any idea shared is my personal view, its not a recommendation, neither any kind of paid propaganda, so please
do your bit of research.
2. Ideas shared does not mean that I trade all or have position in them, this is just a helping hand to all.
3. I expect no comments or like nor any negativity, as I said its just a small helping hand from my side, please plan your risk and trade as per your capacity.
4. To trade in Cash, options or futures is your sole choice and your own risk
5. I am no expert in Tech Indicators, I believe in support resistance and trendline theory, you may use this as a supplement theory for better results.
6. I work for my own living, this is a hobby which I do sincerely to help anyone who might come across my charts.
***********************************************************************************************************************************************


BHEL - Breaking out. Pure technical buyCup and Handle pattern indicated
Previous time frames Indicate white Soldiers indicating an uptrend . Awaiting next candle for confirmation
Buy above 40.10 as various resistances and supported by pivot
Height of cup 25.80
Target 44.40 , 47.75
Rsi 59
Stoch, 40,27


Buy BHEL for Atmanirbhar Bharat rallyBHEL is ready to rally due to Make in India focus announced on Independence day speech... all defence and assosciated will rally like BDL and BEL. as they both already rallied may be bhel will rally on monday


