Technical PickSince majority of the indicator has a bearish views at the current price level, there is much more probability that stock price would fall more.
"Above Idea is for study purpose only, please consult your financial advisor before taking any position."
BHEL trade ideas

BHELDiagonal trendline is broken and price is set to break horizontal resistance level. On day timeframe morning star is formed. You can go long on proper confirmation.


BHEL (LONG)BHEL is following a trendline
Good to buy near this trend line
BUY @ 63
BUY more @ 56
Keep SL 49
Safe to buy only at 56
TGT 77-80-90
Positional Trade
Must Correlate yourself also on charts before taking an entry. This is for Educational purposes only. Please consult your Financial advisor before investing.

Bullish flag pattern in bhelIn day time frame bullsih flag pattern is forming with support of 200Ema, possible breakout in bhel

BHEL DAILY CHART Bhel had re tested its breakout . 68 support , should held , if mkt is supportive then can give big rally like TATA POWER

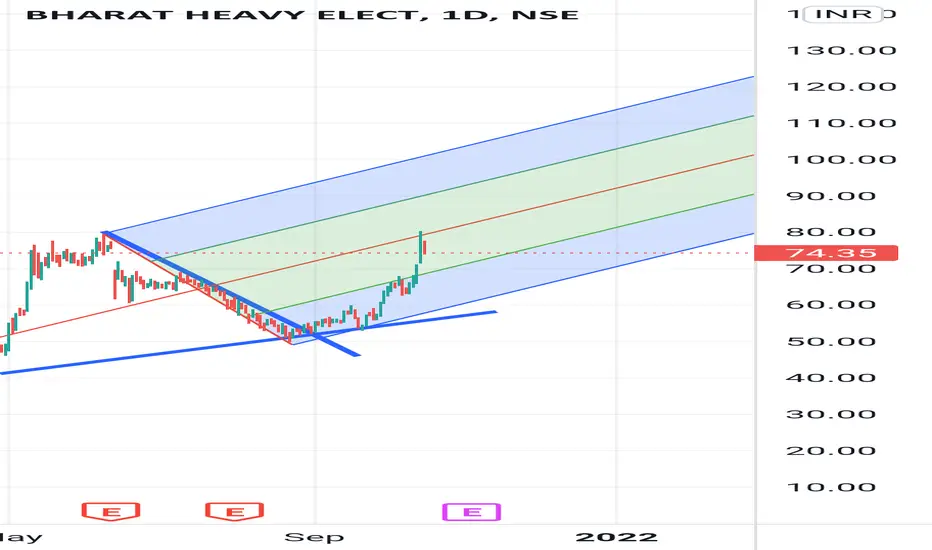
Bhel pitchfork One can buy at lower end of blue line n keep n eye of red line break out for target of 100

Bhel Bhel short covering shown in optra
Monthly reversal strated in September
Reversal monthly fibb
Buy at every dip support

BHEL - BUYBHEL -
Daily RSI - 70 on the over bought zone
However its on an Uptrend
Weekly RSI - 60 so still holds good to see the below target :)
1st Target - 68
Please Like & Follow :)


BHEL looks like coming back to form...Might hit a sixer.BHEL after giving a dream run has been on the sidelines for some time.. It has completed a Bullish Bat pattern on Daily Timeframe and the Price action confirmation on 27th Aug suggests its raring to go again. The RSI is also confirming Bullishness with a Breakout of the Trendline.

BHELBHEL Analysis: BUY
Buy @54
Stop loss @ 52
Target @ 60
I am sure target will hit 75%, wait and see
best wish
shakthi

Long BHELThe stock has broke out from the trendline and also retested , can buy BHEL for positional trade. Also, it has formed morning star candle pattern which can be a good confirmation.
I'm a beginner, i'm just sharing my views.

BHELBhel down phase ended now it's time to a big move... it might be next sail fibonacci short term target 1: 81 and target 2: 90

bhel create short postion The Rsi momentum starts decreasing and adx also deacreasing on a 15 minute time frame


BHELBHEL has taken strong support on trend line, momentum is increasing and volume also increasing. this is very good sign for buy.

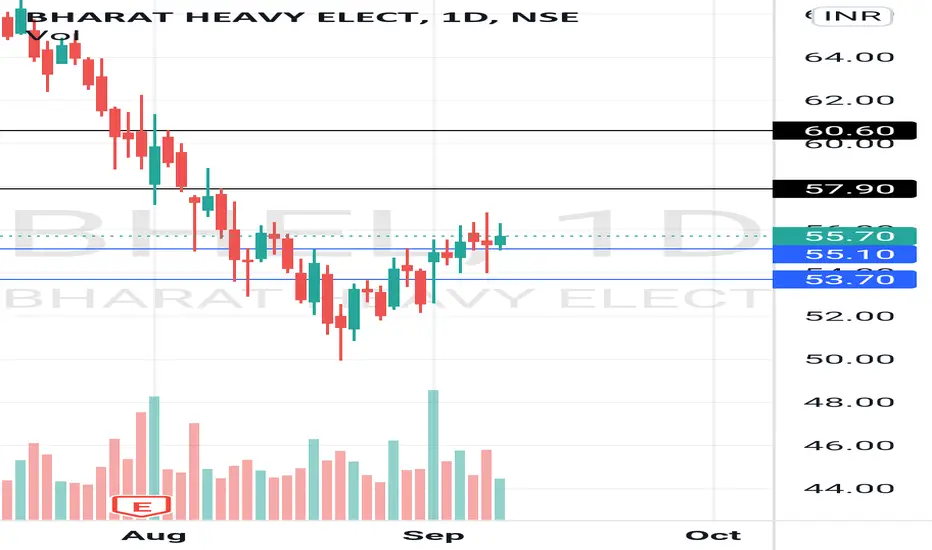
BhelBhel can hit 58-60 in next trading session.
Resistance at 58 and 60. Just for observation not trading.
BHEL , Buy for target of 64It seems that stock has bottomed out and there is buying interest coming in the stock.
Buy BHEL at current levels and Keep stop loss of 51 on days closing basis.
Target for the stock will be 64-65 (15.4% - 17.2%).
Keep a view of 3 months, buy and hold the stock
**Ideas are my own** Take risk as per your risk taking appetite**

BHEL Weekly chartBhel on weekly chart trying to form a head and shoulders pattern. time period ; 1-2 weeks
