Britannia Industries - The Cookie can crumbleThe CEO of the company was featured in an Indian Business magazine, in a very laudatory article. It is a widely held belief that such articles herald the beginning of the decline in the company's business, portended by stock price.
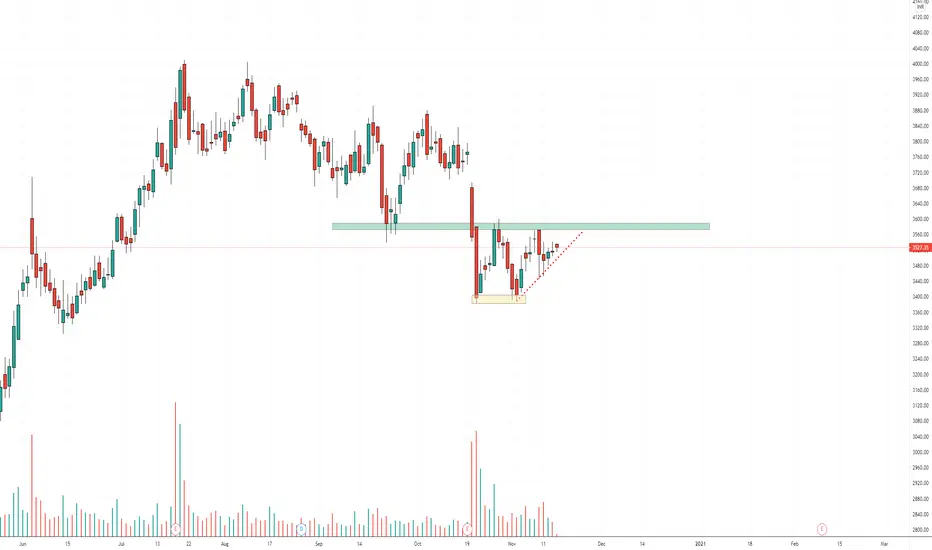
Britannia Industries stock has been a laggard in the massive rally in the last 2-3 months. In fact, it broke down below the resistance and is currently trading in another box, which overlaps the previous box.
It is also trading below its flat-ish 30 WMA.
As an when the winter comes to the stock markets, this stock is likely to crumble. Mark it out as a short candidate.
BRITANNIA trade ideas

Price action strategy at its daily support areaSee all my Publications if it seems to give you both knowledge and profit then only like subscribe and share to your near and dear.
Thanks for my masters trading panthulu, day trader telugu, and nayan pokarkar.
These are all for educational purpose please consult your financial advisor before investing your hard earned money.


Britannia - Intrday / Swing Trade SetupBritannia CMP - 3637.95
Looking bullish in higher time frame. One can go for Intraday / Swing Trade setup with the following entry, exit & targets
Buy at or Above 3645 Only / Stop Loss - 3630
Target 1 - 3655
Target 2 - 3665
Target 3 - 3674 / 3685
Swing Targets - 3750
Disclaimer: This is my view and for educational purpose only. Trade according to your risk and am not responsible for your loss.


Britannia - Ascending Triangle BOBritannia gave asceding triangle breakout and restested . expected a up move. Targets on charts...


BritanniaDue to moderate growth in FMCG sector, this stock has been under accumulation phase for last month. triangle pattern is formed in the daily chart. due to expected growth in the FMCG sector, it has better targets.

QUICK TRADE in BRITANNIA IND buy above or at 3600 multiple resistance of stock around 3600. once crosses 3600 will move very fast. so buy for quick gains. even possible to gap filling at upper levels


Britannia - BullishBritannia CMP - 3552.10
Looking bullish in higher time frame. One can go for Intraday / Swing Trade setup with the following entry, exit & targets
Buy at or Above ONLY 3555 / Stop Loss 3540
Target 1 - 3565
Target 2 - 3575
Target 3 – 3585 / 3595
Swing Trade Target - 3750 / Stop Loss 3515
Disclaimer: This is my view and for educational purpose only.

BRITANNIA Ready for breakout (expecting)Nice wedge pattern Resistance has been tested much time. Chances are there for a breakout.
Only backtesting all the patterns, posted so that it may be useful for anyone. Just an observation of market


BRITANNIA LOOK OUT FOR THESE LEVELS!!! ALL THE LEVELS AND PATTERNS ARE MARKED ON CHART, RED ZONES DENOTES SUPPLY ZONES AND GREEN IS FOR DEMAND ZONE .
BUY ABOVE 3540
The indicator used:
1) Daily Lines plots Daily 20 (BLACK) & 50 EMA (GREY) on lower time frame charts
2) TE-REKAB
- PB : PULLBACK
If you like the analysis, do leave a like and follow for more such content coming up.
The analysis is my POV, hope you got bucks in your pocket to consult a financial advisor before investing :P :)
HAPPY TRADING!

Britannia (Set for a breakout ?)Britannia has formed a consolidation triangle in a daily TF and is looking set for a breakout, hopefully in the coming week. The lower end of the triangle is also protected / supported by 200 EMA. A breach on either side of the triangle can be traded, however with the sentiments of the markets the upper end looks much more imminent.
Things have started to turn towards the positive side, with many things working in India's favour like Increasing growth forecasts by different brokerage / research houses, companies delivering better than expected numbers for Q2, the expectation of having a vaccine soon has brought the Index to its all time high and things are just looking better. However we need to keep in mind that the markets are going up only on the expectation that things will be better, We need to see that even though the numbers for a lot of companies have improved they are still lagging the previous year on a half yearly basis and might de grow on a yearly basis as well, which clearly shows the valuations getting stretched even further. Volatility is here to stay until things don's look certain.
So trade with caution and never over expose.


BRITTANIA SWING!Brittania taking support at 3400 and shows reversal. chances to get a very short term swing trade are high...

BRITANNIA - Bullish H&S Pattern in making - Intraday/Short Term This analysis is purely based on price action and Chart Patterns.
The analysis is on 15min TF hence target can be achieved in intraday trade or in couple of days
Trade strategy is explained in image itself. Don't run after the price.
Always plan your trade & trade your plan
Keep trailing SL accordingly once entered into the trade.
Trade at your own risk and money management
Feel free to comment for any queries & suggestion


BRITANNIABritannia is trading in a falling channel this month. The stock retraced 50% of the previous fall. It looks to be ready for another down leg. The stock can go towards 3350-3325 levels. 62% extension of the previous fall comes around 3340. So the stock can be sold for target of 3350 with a stop above 3625.
