FORMATION OF TREND REVERSAL CANDLE FORMATION OF REVERSAL CANDLE. Watch 15m candle which CANDLE is form and what happen in volume.take DECISSION after conformation of your set up
BRITANNIA trade ideas

BRITANNIA : Short trade oppertunityBRITANNIA
Trading below Monthly VWAP, 20 SMA and low volumes in descending triangle.
If breaks 4000 and sustains, next immediate target will be 3909.
Please add to watchlist and trade carefully - watch market trend.

Britannia looking bullish modegiven breakout from weekly triangle
daily time frame made pole and flag pattern
daily time frame taken support from 40RSI
entry could be taken from bottom of wedge with small sl


Flag Pattern of BritanniaHi,
A flag pattern is clearly visible on the Brittanna Chart of daily candle. Presently it is touching the upper side and if it breaks on closing basis, may see a good upside of 25% to 35% move in near future (my assumption is after breakout it will not take more than 50 days to give 25% returns).
I will keep updated.


Buy BritanniaLong Britannia at its Support and Bullish three dive pattern as well as braekoout in RSI: very good RR Ratio

BRITANNIA BROKE LAST SWING HIGHAfter testing it yesterday, Britannia just broke its last swing high. With decent deliveries if the stock sustains above these levels, it can show a potential upward movement to its high. The stock is also beating the index which in itself is touching all time highs every day. Plus post covid lockdown increased sales will help the company maintain some momentum specially if rural market backs it up.

BRITANNIA to Breakout?BRITANNIA had recently broke the symmetrical triangle pattern and it had also broke a resistance with good volume. Do watch this scrip and long if it had broke major resistance because if you enter now RRR will be poor as the first target will be the major resistance and it is very close.

triangle pattern in britaniaWe can see Britannia trading between these support and resistance creating a triangle pattern and a resistance at shorter term also. We just saw it retracing back from that resistance.

britanniabritania play in range of 3539 to 3584 if break any range upper side or down side level then we can buy or sell in britannia


Britannia Multi Conformation..!In BRITANNIA Following Patterns are available:::
1.. Big Flag and pole Pattern
2.. 200 MA Support
3.. 50 & 200 MA Cross over (WE SAY GOLDEN CROSS OVER) going to happen...!

Brittania Good for Positional TradeBritannia is on good support & looking bullish if sustain on closing basis above 3445 then will be Good for Positional Trade Target will be 3600 -3700 - 3800

BRITANNIA 4HRStrong POTENTIAL REVERSAL ZONE Of Daily & 4HR Bullish Butterfly & Alt Bat
price need to follow Green Trend line & hit target
If price Breaks Red Trend line is where EXIT before SL hits
POTENTIAL BUY

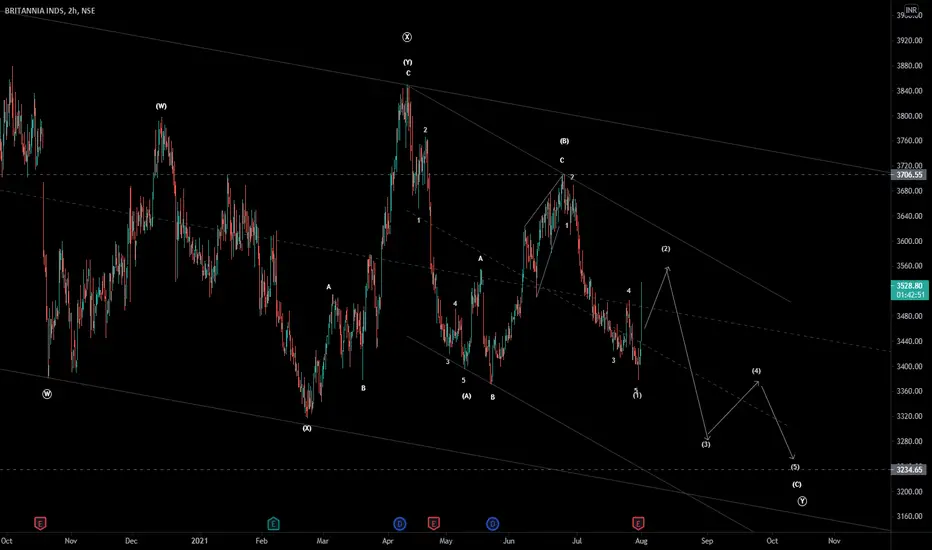
Britannia - Elliott wave Analysis - C of ABC zigzag It is in 2nd subwave correction of C wave of (Y) wave down as discussed in earlier update. Any three wave bounce up between 3530-3630 zone will be good short sell trading opportunity for next move down as C wave as far as it remains below 3707 as invalidation level.
BRITANNIA Daily Bullish BAT & Butterfly Strong potential reversal zone every time was rejected from this level
After getting confirmation with a Bullish candle
POTENTIAL Buy

An opportunity in BRITANNIA INDS HELLO TRADERS, Today we wil discussion on BRITANNIA INDS . as we see in this chart it takes support at 3300 approx three times , so that means we may make a buy position on this stock at the level of above 3500 with a stop loss 3350 for the TGT of 3700 , immediately. so its your choice.

BritanniaValue Buying Opportunity
Long Britannia for Short Term Targets of 3700, 3800++
Approaching strong support zone.

Watch BritanniaWatch Britannia After taking major support it start new rally above 3550 with the help of Volume
Drastically CE OI dropped against ATM PE OI gained ...
It indicates Short covering Possible
Keep in your Watch List

BRITANNIAIs in consolidation from last 1 year
looking like completed WXYXZ wave pattern
One can enter here partially at,
Cmp- 3490
SL- 3200 (closing base)
Target- 3700....3850....4000....4500....5200
(Big move expected only after daily closing above 4050)


