DCF VALUATION ANALYSIS OF BSEConclusion: OVERVALUED
:-OVERVIEW
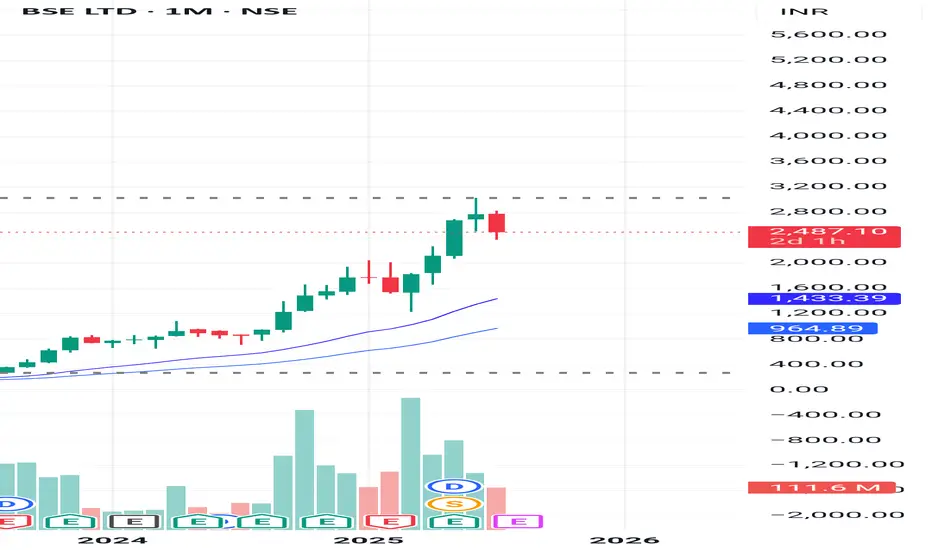
BSE Limited has shown strong financial growth in recent years. Its revenue jumped from ₹924.84 crore in FY23 to ₹1,592.50 crore in FY24 (a 72% increase), and further surged to ₹3,212 crore in FY25, doubling year-on-year. EBITDA grew impressively to ₹1,779 crore in FY25 with a 60% increase, and EBIT reached ₹1,670 crore, up 56%. Net profit also rose significantly to ₹1,112 crore, with earnings per share increasing to ₹81. Dividend per share improved to ₹23, reflecting healthy returns
DCF:
-The valuation was performed using a Discounted Cash Flow (DCF) approach based purely on verified financial data and market risk parameters without relying on user-specific growth assumptions.
-The cost of equity was calculated using an adjusted risk-free rate plus equity risk premium multiplied by beta, resulting in a discount rate of approximately 13.58%. The terminal growth rate was conservatively taken as 4%. Using these reliable inputs and actual EBIT cash flows, the intrinsic enterprise value was estimated at around ₹36,839 crore, translating to an intrinsic value per share of approximately ₹1,364.
-Currently, BSE’s market price is around ₹2,480 per share, which is substantially higher than the intrinsic value derived from fundamentals, indicating the stock is trading at a significant premium. This valuation is grounded in audited company financials and globally accepted valuation methodologies, providing a trustworthy reference point for investors.
BSE trade ideas
BSE at resistance, Long TradeBSE is closes above 2550 then it may give a good up ward move of 50 to 100 points.
On a bullish candle stick pattern and breakout at 2550 a Long call can be taken.
Entry after 2550 ( bullish candle stick pattern and breakout)
SL 2500
Target1: 2600
Target2: 2650.

BSE-Swing trade-Very bullish-Is profit booking over?
Buy-2820
Target-2943
SL-2688
Buy-2820
Target-2943
SL-2688
Positives
Trend, Pullback
Fairvalue gaps
0.5 Fibonacci
21 EMA
Resistance turned to support pullback

BSE💼 BSE Trade Plan Details
Parameter Value
Entry Price 2079
Stop Loss (SL) 1861
Risk 218 pts
Reward 1924 pts
Target 4003
Risk:Reward (RR) 8.8
🔎 Reference Data
Last High 3026
Last Low 2049
Point Var 977
✅ Key Observations & Strategic Notes
Trend Strength: All HTF, MTF, and ITF are in a confirmed uptrend.
Entry Zone: 2079 is right around the MTF average proximal zone — indicating a strong base for long entry.
Stop-Loss Safety: SL at 1861 is just below the weekly demand zone — providing a safe cushion.
Reward: A target of 4003 gives you a clean Risk:Reward ratio of 8.8, which is highly favorable.
Volume Play: Since price is near the recent low (2049), any break above recent consolidation could trigger momentum toward 3000+ zone.
60M Distal Zone at 8544 seems like a data error (likely a typo) — not aligned with other ITFs or HTFs.
⚙️ Recommendation
Entry looks optimal with alignment across MTF.
If BSE consolidates between 2040–2080, consider adding more positions with tighter SL using ITF (60m) confirmations.
Consider partial profit booking near 3000, then trail SL for extended target at 4003.
📈 BSE Multi-Timeframe (MTF) Analysis Summary
All timeframes signal a strong bullish trend, confirming buy-side conviction across HTF, MTF, and ITF.
🔷 High Time Frame (HTF) – Long-Term Demand Zones
Timeframe Trend Analysis Proximal Distal Avg
Yearly UP RALLY RALLY 857 641 749
Half-Yearly UP RALLY RALLY 1078 702 890
Quarterly UP Breakout + Demand 2038 1654 1846
HTF Avg 1324 999 1162
🔷 Mid Time Frame (MTF) – Medium-Term Demand Zones
Timeframe Trend Analysis Proximal Distal Avg
Monthly UP Support 2038 1654 1846
Weekly UP Support 2038 1861 1950
Daily UP DMIP + BUFL Demand 2162 2088 2125
MTF Avg 2079 1868 1974
🔷 Intraday Time Frame (ITF) – Short-Term Demand Zones
Timeframe Trend Analysis Proximal Distal Avg
240 Min UP DMIP Demand 2162 2088 2125
180 Min UP DMIP Demand 2162 2088 2125
60 Min UP DMIP Demand 2079 8544 5312
ITF Avg 2134 4240 3187


BSE - BUY THE FEAR, SELL THE GREED !"Buy the fear, sell on greed" is an investment strategy that means you should buy assets when most investors are scared and selling (during periods of fear), and sell those assets when most investors are excited and buying (during periods of greed).
Why does this work?
⦁ When fear dominates the market, prices often drop below their true value because people panic and sell at low prices. This creates opportunities for disciplined investors to buy quality assets at a discount.
⦁ When greed takes over, prices often rise above their real worth because people are eager to buy, hoping for quick gains. This is usually a good time to sell, as the risk of a downturn increases.
How do emotions affect markets?
⦁ Fear leads to panic selling, causing prices to fall further and often locking in losses for those who sell at the bottom.
⦁ Greed leads to speculative buying, driving prices higher and sometimes creating bubbles that eventually burst.
Why is it hard to follow?
⦁ While the idea is simple, it is emotionally difficult to buy when everyone else is pessimistic and selling, or to sell when everyone else is optimistic and buying. Most people act on emotion rather than logic, which is why few consistently succeed with this approach.
Practical example:
During a market crash, negative news and panic cause many to sell at low prices. A disciplined investor who buys during this fear can benefit when the market recovers. Conversely, when markets are booming and everyone is rushing to buy, selling at this point can help lock in gains before a potential correction.
Key takeaway:
This strategy is about removing emotion from investing decisions and taking a contrarian approach—buying when others are fearful and selling when others are greedy—rather than following the crowd. This approach has been used by successful investors like Warren Buffett to achieve long-term success by focusing on value and maintaining emotional discipline.

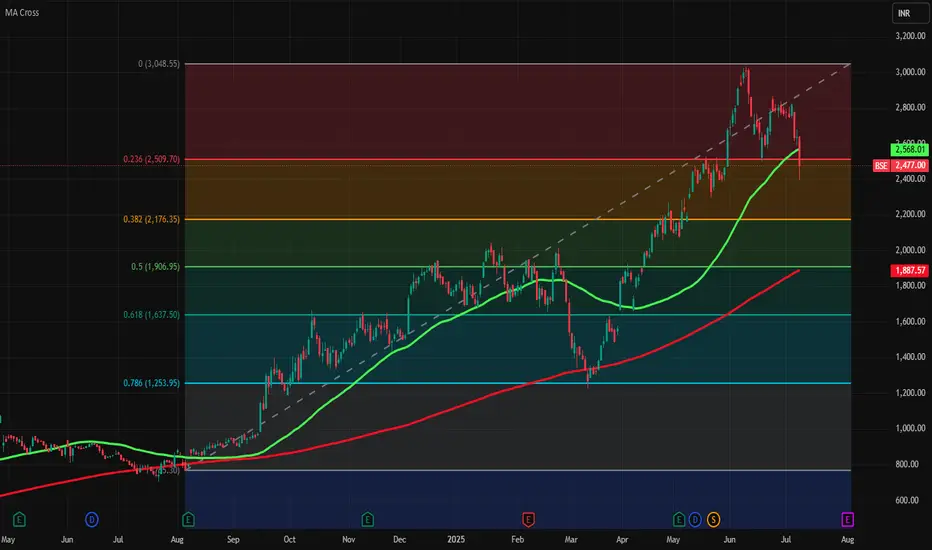
Fresh buying and selling entry in BSEAs we can watch it is falling 50 days moving average (green line) and fall from its support of 2509 and currently selling entry is possible in it till 2176.35 and if it more fall the next level of support is 1907.
Fresh buying is possible at near 2176.35 level and SL is 1907 and TPs are 2509 and 3048.
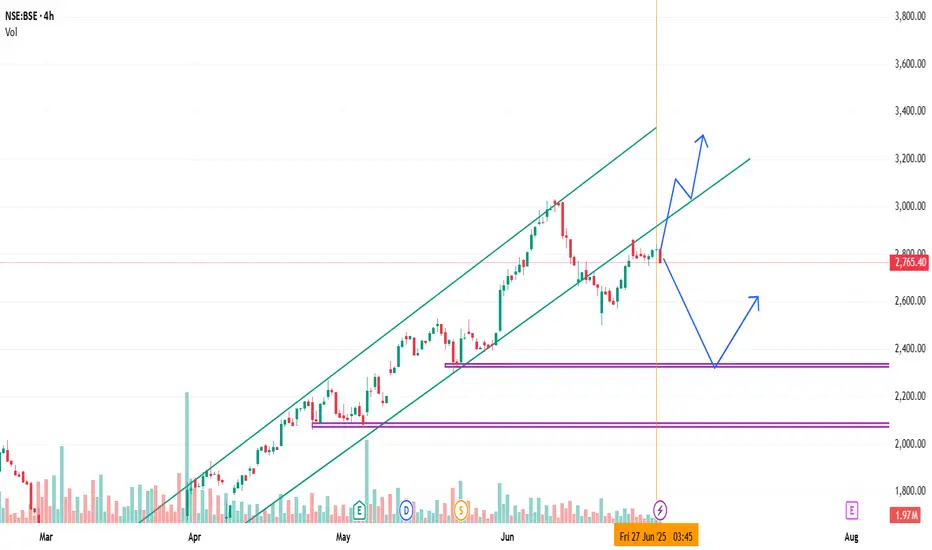
BSE breaking the channelAs the analysis is showing it has breaked the channel and retested support moving towards downward level 2326
BSE Ltd – Completion of a 5-Wave ImpulseBSE Ltd appears to have completed a five-wave impulsive advance following a prior flat correction. Wave 5 has reached the 1.618 Fibonacci extension of Wave 1 and touched the upper boundary of a well-defined ascending channel — suggesting a potential short-term top.
If a correction unfolds from here, it may take the form of a zigzag or a flat. Key Fibonacci retracement levels to watch:
Target 1: 2,159 – 0.382 retracement
Target 2: 1,981 – 0.5 retracement
Target 3: 1,803 – 0.618 retracement
The invalidation level for this setup is around 2,736.20 . A sustained move above this would indicate that the uptrend may still be in progress.
Price action in the coming sessions will be key to confirming the next direction.
Disclaimer: This analysis is for educational purposes only and does not constitute investment advice. Please do your own research (DYOR) before making any trading decisions.

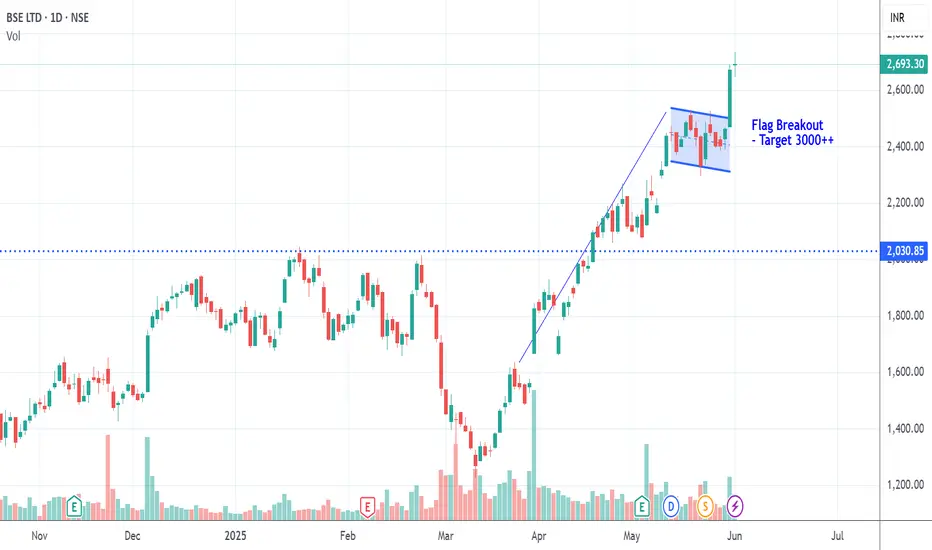
BSE- FOR LONG AND SWING TRADEAfter a very good side ways trend price has given a breakout in Daily Time frame.
Today closing price was 2693.30 and it has formed a Doji candle.
It may retest that consolidation area and again it can give us a good move upside till 3000.

BSE_Long_Flag Pattern_Daily TimeFrameBSE:
Breakout from the Flag Pattern, giving potential runway in the long side.
Disc: Only for Educational purposes only

BSE @ 10K by the end of 2025?BSE trading at all time high - price doubled from the low of the last three months.
Looks very strong - potential pull back areas are near 7700, 8650.
do you think BSE will hit 10K in the next few months?
Disclaimer: Not a buy / Sell recommendation.

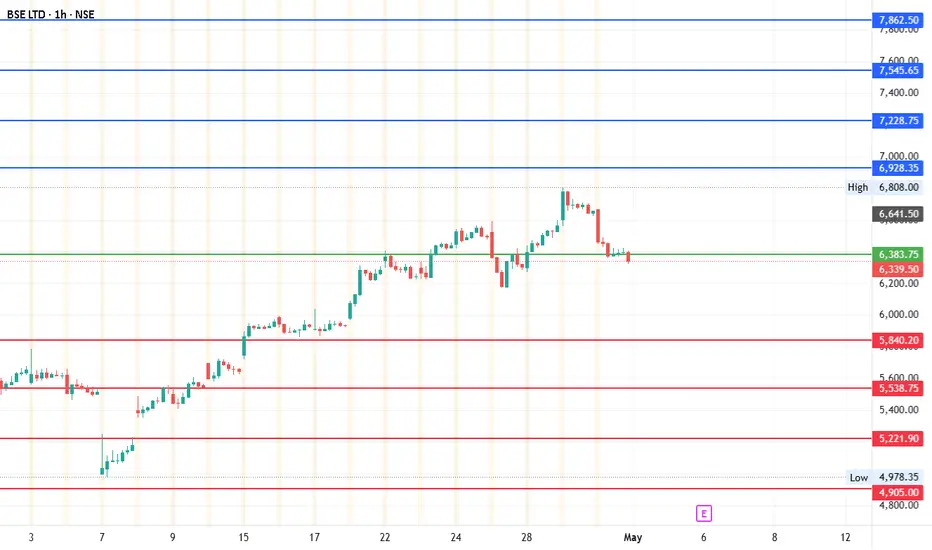
BSE - 1000 Points move on cards? Up or Down?It's ready to move 1000 points but which direction? we shall work on directionless move but the length of the move.
Current Price: 6359
Mid-point: 6383.75
upside levels: 6928.36, 7228.75, 7545.63 and 7862.50
Downside levels: 5840.19, 5538.75, 5221.88 and 4905.00
Stop loss: 6141.64
Resistance: 6627.98
BSEBSE
MTF MTF-Zone TREND MTF Analysis Logic Average
HTF Yearly UP BSEYearly Demand RR 2,275
HTF Half-Yearly UP BSE6 Month Demand RR 2,609
HTF Qtrly UP BSEQtrly Demand BUFL RBR 3,945
MTF Monthly UP BSEMonthly Demand RR 3,945
MTF Weekly UP BSEWeekly Demand DMIP 3,958
MTF Daily UP BSEDaily Demand DMIP BUFL 5,953
ITF 240M UP BSE240Mn Demand BUFL 5,953
ITF 180M UP BSE180 Mn Demand BUFL 5,953
ITF 60M UP BSE60 Mn Demand BUFL 5,953
Trade Plan ENTRY-1
Entry-1 6040
Entry-2 4825
SL 4270
RISK 1770
REWARD 4602
Target as per Entry 10642
RR 2.6
Last High 6162
Last Low 3861

BSE - BSE Ltd. (45 mins. chart, NSE) - Long Position; short-termBSE - BSE Ltd. (45 mins. chart, NSE) - Long Position; short-term research idea.
Risk assessment: High {volatility risk}
Risk/Reward ratio ~ 3
Current Market Price (CMP) ~ 6480
Entry limit ~ 6370 to 6430 (Avg. - 6400) on April 23, 2025
1. Target limit ~ 6500 (+1.56%; +100 points)
2. Target limit ~ 6700 (+4.69%; +300 points)
Stop order limit ~ 6300 (-1.56%; -100 points)
Disclaimer: Investments in securities markets are subject to market risks. All information presented in this group is strictly for reference and personal study purposes only and is not a recommendation and/or a solicitation to act upon under any interpretation of the letter.
LEGEND:
{curly brackets} = observation notes
= important updates
(parentheses) = information details
~ tilde/approximation = variable value
-hyphen = fixed value

BSE | Buy @LTP | SL below 5700 | Target 8400Disclaimer:
This is not financial advice. Please do your own research or consult with a financial advisor before making any investment decisions. Investments in stocks can be risky and may result in loss of capital.

BSE BSE
As of now the stock is close to daily Supply
-Price Can Retest Weekly & Daily Demand
Add : 4563:
Add: 4233
Add : 3978
MTF Analysis Remarks
BSEYearly Demand 2,595
BSE 6 Month Demand 3,264
BSE Qtrly Demand 4,200
BSEMonthly Demand 4,200
BSEWeekly Demand DMIP 4,233 BUY
BSEDaily Demand Demand SOE 4,563 BUY
BSEDaily Demand DMIP CAP-DMIP 3,978 BUY
ENTRY -1 Long 4,233
SL 3,800
RISK 433
Target as per Entry 8,685
RR 10
Last High 6,183
Last Low 3,681

bse ltd 6050bse 6050
Bombay Stock Exchange (BSE) is one of the oldest stock exchanges in Asia, established in 1875. It is headquartered in Mumbai, India, and serves as a major platform for trading stocks, bonds, derivatives, and other financial

BseBSE is showing a strong technical setup, forming a bullish pattern with increasing momentum. Could lead to a rally toward 6100 in the coming sessions!

BSE +13% upside potentialSharing with you a breakout stock before the weekend, BSE today breakout its previos High 10 to 15% upside potential. holding period 1-2 week.

BSE LTD S/RSupport and Resistance Levels:
Support Levels: These are price points (green line/shade) where a downward trend may be halted due to a concentration of buying interest. Imagine them as a safety net where buyers step in, preventing further decline.
Resistance Levels: Conversely, resistance levels (red line/shade) are where upward trends might stall due to increased selling interest. They act like a ceiling where sellers come in to push prices down.
Breakouts:
Bullish Breakout: When the price moves above resistance, it often indicates strong buying interest and the potential for a continued uptrend. Traders may view this as a signal to buy or hold.
Bearish Breakout: When the price falls below support, it can signal strong selling interest and the potential for a continued downtrend. Traders might see this as a cue to sell or avoid buying.
MA Ribbon (EMA 20, EMA 50, EMA 100, EMA 200) :
Above EMA: If the stock price is above the EMA, it suggests a potential uptrend or bullish momentum.
Below EMA: If the stock price is below the EMA, it indicates a potential downtrend or bearish momentum.
Trendline: A trendline is a straight line drawn on a chart to represent the general direction of a data point set.
Uptrend Line: Drawn by connecting the lows in an upward trend. Indicates that the price is moving higher over time. Acts as a support level, where prices tend to bounce upward.
Downtrend Line: Drawn by connecting the highs in a downward trend. Indicates that the price is moving lower over time. It acts as a resistance level, where prices tend to drop.
Disclaimer:
I am not a SEBI registered. The information provided here is for learning purposes only and should not be interpreted as financial advice. Consider the broader market context and consult with a qualified financial advisor before making investment decisions.

Short BSE LtdHuge run up in last one year almost 10x and 2.5x in last 6 months
Lower High twice (need to do thrice for formation to complete)
Bearish Engulfing made at resistance level which was support of previous swing
Follow through after bearish engulfing
SL and Entry price mentioned in Chart
Track sector to gauge strength of Sector
AngelOne is weak on Chart
