BSE LONGBSE share has made a rounding bottom, did a breakout and retest and now should follow to the target.
BSE trade ideas

Diamond Pattern Diamond Pattern. Needs good volume breakout.
This is a rare chart pattern but if gives good breakout we will get good results

BSE LONGBSE
MTF Analysis
BSE Weekly Demand BUFL 2570
BSE Weekly Demand DMIP 2274
BSE DAILY DEMAND 2528
ENTRY 2528
SL 2376
RISK 152
Target 3190
REWARD POINT 662
Last High 2859
RR 4.36


Head&shoulder pattern in BSEHead & shoulder pattern breakout will be possible in it keep eye on it .
Buy bse only above 2660 (closing)
Target 2761 2885 3112 3252
Sl 2490


BSE Long Opportunity Currently price at instutution buying zone so we can invest 60% qty from current level.
Balance 40% add at if price will comes at near 2300 (Very Strong Institution Buying Zone)
Trade at your OWN risk.
I am not SEBI Registered.
Target 1 - 2700
Target 2 - 2900
Target 3 - 3050

BSEI Observed these Levels based on price action and Demand & Supply which is My Own Concept Called "PENDAM CONCEPTS" ... Please Don't Take any trades based on this chart/Post...because this chart is for educational purpose only not for Buy or Sell Recommendation.. Thank Q


BSE TARGET 2765 STOPLOSS 2551Script is in consolidation with good bullish weekly closing reversing. And also consecutively printed fourth intraday higher and high level with good volume.

BSE ltd - what's my trade plan 📈💡NSE:BSE
Performance: BSE LTD's performance in the market has been stable with significant growth in its key business segments.
Market Dominance: BSE LTD continues to dominate as one of the leading stock exchanges in India, dealing with a wide array of asset classes.
Technological Advancements: BSE LTD has made significant technological advancements to provide efficient and robust trading systems.
Revenue Streams: BSE LTD has diverse revenue streams such as transaction charges, depository charges, membership fees, and listing fees, contributing to its stable financial performance.
Regulatory Compliance: BSE LTD operates under strict regulatory compliance, ensuring the interest of investors.
Partnerships: BSE LTD has formed strategic partnerships globally, enhancing its market reach and influence.
Investment Opportunities: With a high potential for growth, BSE LTD presents promising investment opportunities for traders and investors.
disc: Invested , will look for averaging up

BSE ltd - what's new trade plan 📈💡BSE Ltd What's my new trade plan NSE:BSE
If you've been following the stock market, you may have noticed that BSE LTD was one of the biggest wealth creators last year and is now setting up nicely. I covered the company's fundamentals in a previous analysis, which you can find through the link below.
Added now with anticipation will be a weekly breakout
and thereafter, you can follow me here and connect with me social media - will share more details
Covered more in detail in video earlier
As a disclosure, I'm holding shares from the first trade plan (which were free) and have since added more, but please note that this is not a recommendation.

SWING IDEA - BSE LTDBSE, one of the leading stock exchanges in India, is showing technical indicators that suggest a potential swing trading opportunity.
Reasons are listed below :
Strong Support Zone at 2600 : The 2600 level has proven to be a robust support zone, indicating significant buying interest and a strong base for a potential price rebound.
Bullish Marubozu Candle : The recent formation of a bullish marubozu candle, characterized by little to no shadows, indicates strong buying pressure and a potential for continued upward movement.
50 EMA Support : The stock is finding support at the 50-day exponential moving average, which reinforces the overall bullish sentiment and provides a reliable support level.
0.5 Fibonacci Support : The price has found support at the 0.5 Fibonacci retracement level, indicating that this key level is acting as a strong base for a potential bounce back.
Target - 3070 // 3250
Stoploss - Daily close below 2570
DISCLAIMER -
Decisions to buy, sell, hold or trade in securities, commodities and other investments involve risk and are best made based on the advice of qualified financial professionals. Any trading in securities or other investments involves a risk of substantial losses. The practice of "Day Trading" involves particularly high risks and can cause you to lose substantial sums of money. Before undertaking any trading program, you should consult a qualified financial professional. Please consider carefully whether such trading is suitable for you in light of your financial condition and ability to bear financial risks. Under no circumstances shall we be liable for any loss or damage you or anyone else incurs as a result of any trading or investment activity that you or anyone else engages in based on any information or material you receive through TradingView or our services.
@visionary.growth.insights

BSE Long PositionalBuy BSE above 2587.20
Looking very strong on weekly and Daily time frame, retest completed after Pole and flag formation, RSI & ADX also supporting, Volume also started building up
Targets : 2950-3328-3670
SL 2100
Duration few Weeks


BSE ready to run again?The stock has made a bullish flag pattern. It has been consolidating in the last few sessions, volume activity and DMI show bullish strength. It looks good for another run in the short term. other stocks in this sector also look positive
Entry - 2856
SL - 2700
Tgt - 3680

#BSE making pole n flag pattern, above 2934 fatega kya?#BSE CMP 2768, broke out on 1st April 2024 and since then has been consolidating in a small range of 2900-2700 and has made pole n flag structure along with an inside candle pattern.
Breakout above 2894 can take it towards 2971/3005(imp level)/3093/3256/3435/3529/3663(imp level). Below 2529 it will become weak.

BSE stock analysisI have added few comments on BSE stock
You may add to your watchlist for swing trading

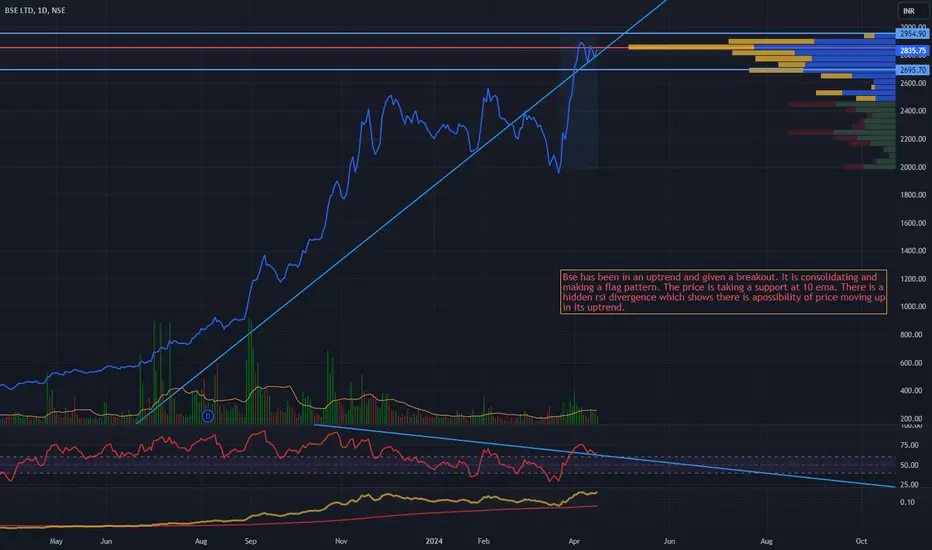
Bse ltdPrice is in an uptrend and consolidating in a flag pattern. Presence of hidden rsi bullish divergence shows price can continue its uptrend.

Bse ltdPrice is in an uptrend and consolidating in a flag pattern. Presence of hidden rsi bullish divergence shows price can continue its uptrend.