Canara Bank FVG filled, Long TradeFVG created in Canara Bank is completely filled, if it sustains and breaks 116 then it may go up from here.
Entry at 116 on bullish candle stick pattern.
SL 112
Target 120+
CANBK trade ideas

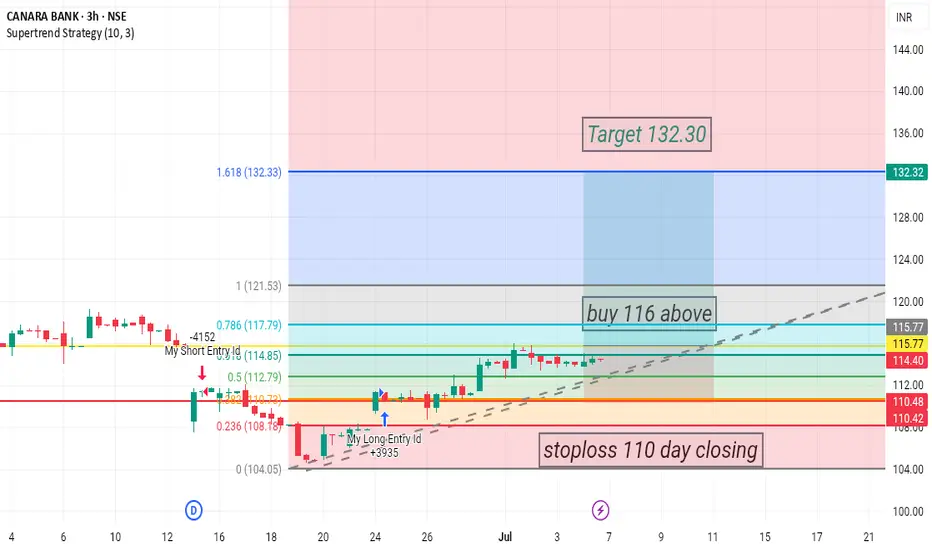
My pick CANBANK An extremely bullish Reversal , my target 132.30The stock is in continuous uptrend , with no evidence of sellers in major time frame
As my chart technical sep 2024 monthly pattern bullish
Enter cmp -114.37
strong buy 116 above
My target - 132.30
Stoploss - 110 day closig
I am not sebi reg
is my own idea only
Canara Bank BuyCanara Bank seems to take support at trend line. Buy @CMP (111) with SL of 104.5 and target of 120 & 125

Canara Bank - Its not recommendation or Financial Advice Certainly I am bullish on Canara Bank as stock took its 1st support on 50 DMA after golden cross. Looking Backwards - its also breached previous support / Previous logical SL and closed above it.
I may enter after proper confirmation and with proper risk management

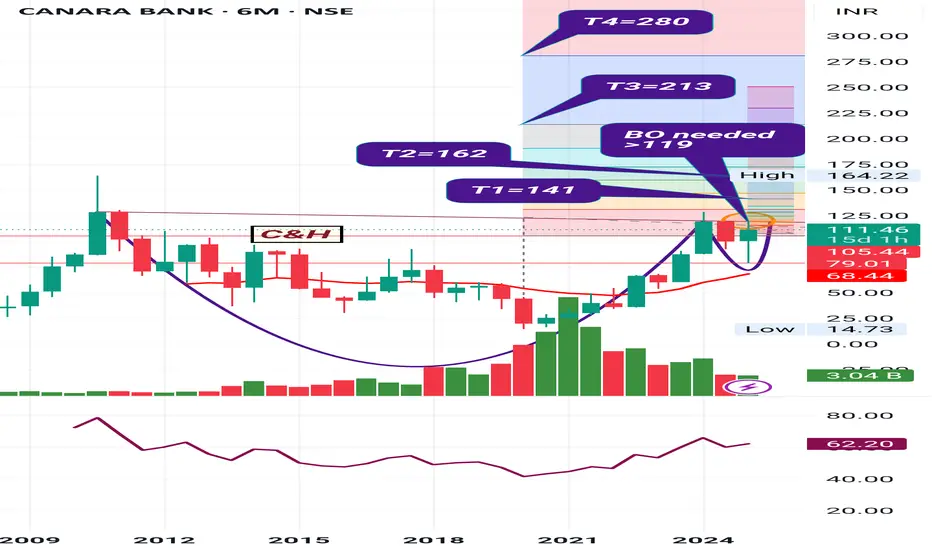
Canara Bank*Canara Bank Ltd.*
C&H; Formation on Decadal basis.
Strong Bouceback from Support Zone.
Volume Traction picking up.
RSI: 1H W>M. Above 1H, All in Bullish zone.
EMAs: Widening Gaps amongst 50 /100 /200 levels on Monthly Basis.
*Trail SL with Upside*
*Book Profit as per Risk Appetite*
Improving Financials. Rising Revenue on Qtrly /Yrly basis. Improving GNPA/NNPA levels. Improving CRAR.
Promoter Stake Constant. FII Declined/DII Increased.
*This is an Opinion. Do your own research as well.*
*_Happy Investing_*🤓
Canara Bank: Rounding Bottom Breakout in Progress!🚀 Canara Bank: Rounding Bottom Breakout in Progress! 🚀
📉 CMP: ₹111.8
🔒 Stop Loss: ₹104
🎯 Targets: ₹126 | ₹140
🔍 Why It Looks Promising?
✅ Rounding Bottom Formation
✅ Breakout Above Key Fibonacci 62% Level
✅ Sectoral Strength: Banking & Financials are poised to lead the next leg of the Nifty rally—and Canara Bank could be a key driver.
💡 Strategy & Risk Management
📈 Staggered Entry: Accumulate in phases near support for better risk control
🔒 Strict SL: Protect downside with a disciplined stop loss at ₹104
📍 Outlook: Strong technical breakout with sector tailwinds makes Canara Bank a compelling swing and positional trade setup.
📉 Disclaimer: Not SEBI-registered. Please conduct your own research or consult a financial advisor before investing.
#CanaraBank #BankNifty #BreakoutTrade #FibonacciLevels #SwingTrading #TechnicalAnalysis #StockMarketIndia #InvestSmart

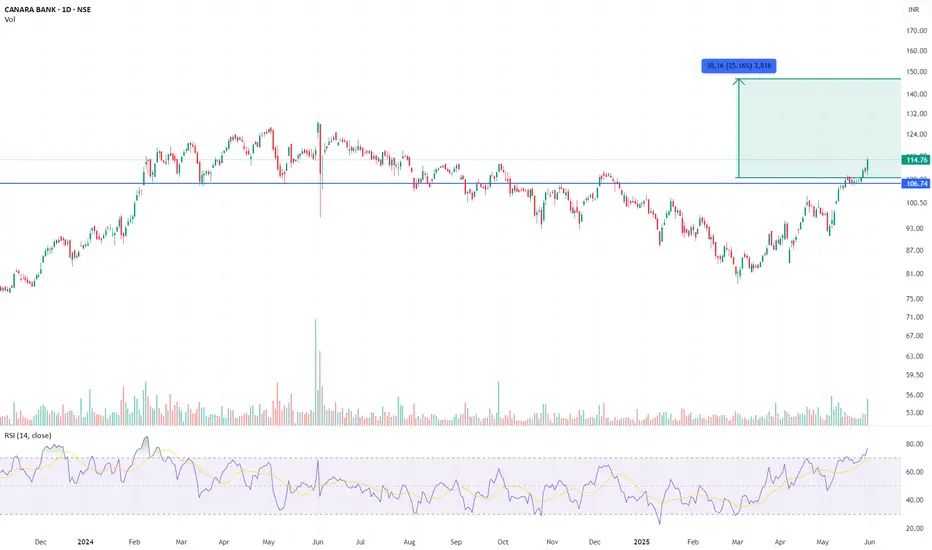
Canara Bank – Breakout With Retest, Momentum BuildingBullish | Timeframe: 1Y | Type: Positional Swing
Chart Setup:
Canara Bank has broken out of a 15-month consolidation zone above the ₹112–₹114 resistance, which acted as a neckline. Price rallied sharply from the ₹85 base, and the breakout was supported by strong volumes and momentum.
The most recent candle shows a shallow retest, with an intraday dip to ₹109 followed by a strong close above the breakout zone — classic confirmation of support holding.
Measured Move Target: ₹150–₹160
Invalidation / Stop Loss: Close below ₹108
Rationale:
Strong price-volume structure
Retest of breakout zone successful
PSU banking theme in favour
Momentum intact above all major moving averages
Disclaimer:
This idea is purely for educational purposes and reflects a technical setup based on chart patterns and price action. It is not a recommendation to buy or sell securities. PSU banks can be volatile and sensitive to macro/policy triggers. Traders should manage risk independently, use stop-loss, and size positions based on personal risk tolerance. Always do your own due diligence before taking any trade.
Weekly price action of Canara Bank (NSE).Technical Summary (as of May 31, 2025):
Breakout Confirmed: The price has broken out above a descending trendline resistance, signaling a bullish reversal.
Strong Weekly Candle: A large bullish candle (+7.04%) confirms strong buying interest.
Resistance Levels:
Immediate resistance at ₹120
Next major resistance at ₹126.59
Support Zone: ₹102–105 (previous resistance, now potential support)
Uptrend Structure: Long-term trendline from 2022 remains intact and supportive.
🔎 Outlook:
Bullish bias in the short to medium term, especially if the stock sustains above ₹114.
Watch for profit booking near ₹120–126.59.

CANBKCANBK
watch above levels. green line is our entry, redline is our SL.
DISCLAIMER : I am NOT a SEBI registered advisor or a financial adviser. All the views are for educational purpose only.
Canara BankCanara Bank
MTF Analysis
Canara BankYearly Demand 50
Canara Bank 6 Month Demand 69
Canara BankQtrly Demand BUFL 66
Canara BankMonthly Demand 78
Canara BankWeekly Demand 82
Canara BankDaily Demand DMIP 78
ENTRY -1 Long 82
SL 70
RISK 12
Target as per Entry 178
RR 8
Last High 128
Last Low 78

CANBK Long Fundamental backed stock in reversal
just for learning purposes.
Keep an eye out for volume, RSI and MACD gap

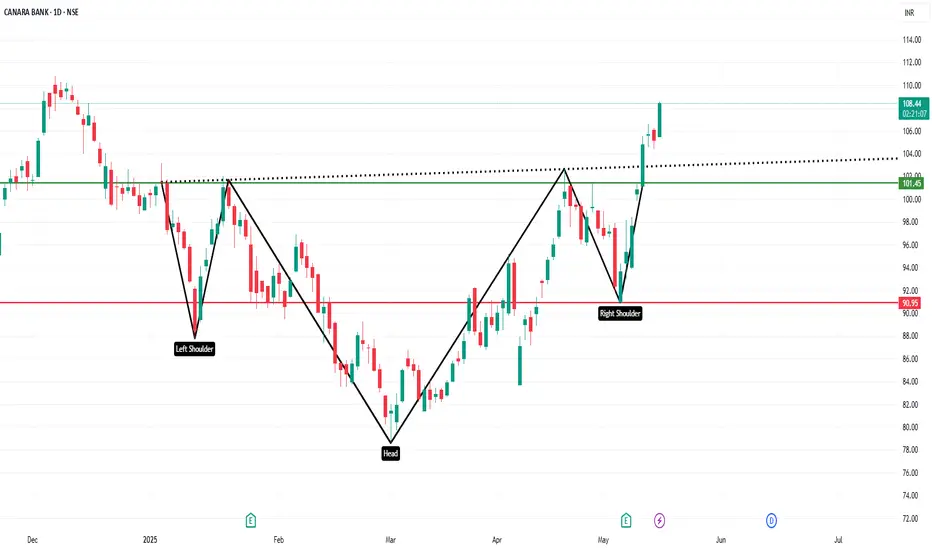
LONGDouble bottom done, positive RSI divergence visible. current price is at resistance. once crossed with positive volume, then it may move north.

JUST DO NOT MISS THIS STOCK - CANARABANK LTDEverything is pretty much explained in the picture itself.
I am Abhishek Srivastava | SEBI-Certified Research and Equity Derivative Analyst from Delhi with 4+ years of experience.
I focus on simplifying equity markets through technical analysis. On Trading View, I share easy-to-understand insights to help traders and investors make better decisions.
Kindly check my older shared stock results on my profile to make a firm decision to invest in this.
For any query kindly dm.
Thank you and invest wisely.

LONGTriangle beak out/ break out from trend line, may the line act as support zone. Volume buzz seen. expected to go up anticipating good results.

Will Canara Bank Break Out Due to Its Strong Performance?Canara Bank has shown solid momentum recently, leaving traders wondering: Is a breakout on the horizon? With the stock exhibiting strength, key resistance levels are being tested. The question now is, will the stock push through and initiate a breakout, or will it face rejection at this crucial point?
What do you think? Can Canara Bank’s recent performance trigger the next big move, or is a pullback in sight? Let us know your thoughts!

Canara Bank can become a cool Investment. Canara Bank engages in the provision of commercial banking and financial services. It operates through the following segments: Treasury, Corporate or Wholesale Banking, Retail Banking, and Other Banking Business.
Canara Bank CMP is 109.30. The positive aspects of the company are cheap Valuation (P.E. = 6.3), Company with Zero Promoter Pledge, Mutual Funds Increased Shareholding over the Past Two Months, Dividend yield greater than sector dividend yield, Annual Profit Growth higher than Sector Profit Growth and Rising Net Cash Flow and Cash from Operating activity. The Negative aspects of the company are High Interest Payments Compared to Earnings, Stocks Underperforming their Industry Price Change in the Quarter and MFs decreased their shareholding last quarter.
Entry can be taken after closing above 109.75. Targets in the stock will be 113, 117 and 122. The long-term target in the stock will be 124 and 129. Stop loss in the stock should be maintained at Closing below 100.
Disclaimer: The above information is provided for educational purpose, analysis and paper trading only. Please don't treat this as a buy or sell recommendation for the stock. We do not guarantee any success in highly volatile market or otherwise. Stock market investment is subject to market risks which include global and regional risks. We will not be responsible for any Profit or loss that may occur due to any financial decision taken based on any data provided in this message.

Investment Opportunity - Canara BankAs an investor, you need to think exact opposite of traders (in FUNDAMENTALLY strong stocks).
At these major breakdown levels, big players get enough quantities to buy the promising investment opportunities.
To outperform 90% people, you need to out-think them first.
This idea is to spread awareness and should not be considered as basis of any financial commitment. DO YOUR OWN RESEARCH BEFORE TRADING/INVESTING.

Canara Bank Can start after consolidation.Canara Bank engages in the provision of commercial banking and financial services. It operates through the following segments: Treasury, Corporate or Wholesale Banking, Retail Banking, and Other Banking Business.
Canara Bank CMP is 112.77 The positive aspects of the company are low Valuation (P.E. =6.5), Annual Profit Growth higher than Sector Profit Growth, Increasing profits every quarter for the past 2 quarters, Company with Zero Promoter Pledge, Mutual Funds Increased Shareholding over the Past Two Months and FII / FPI or Institutions increasing their shareholding. The share has good dividend yield of 2.9% at CMP. The Negative aspects of the company is that the stocks is underperforming their Industry Price.
Entry can be taken after closing above 114 Targets in the stock will be 117 and 122. The long-term target in the stock will be 124 and 129. Stop loss in the stock should be maintained at Closing below 105.
The above information is provided for educational purpose, analysis and paper trading only. Please don't treat this as a buy or sell recommendation for the stock. We do not guarantee any success in highly volatile market or otherwise. Stock market investment is subject to market risks which include global and regional risks. We will not be responsible for any Profit or loss that may occur due to any financial decision taken based on any data provided in this message.

CANRA BANK S/RSupport and Resistance Levels:
Support Levels: These are price points (green line/share) where a downward trend may be halted due to a concentration of buying interest. Imagine them as a safety net where buyers step in, preventing further decline.
Resistance Levels: Conversely, resistance levels (red line/shade) are where upward trends might stall due to increased selling interest. They act like a ceiling where sellers come in to push prices down.
Breakouts:
Bullish Breakout: When the price moves above resistance, it often indicates strong buying interest and the potential for a continued uptrend. Traders may view this as a signal to buy or hold.
Bearish Breakout: When the price falls below support, it can signal strong selling interest and the potential for a continued downtrend. Traders might see this as a cue to sell or avoid buying.
20 EMA (Exponential Moving Average):
Above 20 EMA: If the stock price is above the 20 EMA, it suggests a potential uptrend or bullish momentum.
Below 20 EMA: If the stock price is below the 20 EMA, it indicates a potential downtrend or bearish momentum.
Trendline: A trendline is a straight line drawn on a chart to represent the general direction of a data point set.
Uptrend Line: Drawn by connecting the lows in an upward trend. Indicates that the price is moving higher over time. Acts as a support level, where prices tend to bounce upward.
Downtrend Line: Drawn by connecting the highs in a downward trend. Indicates that the price is moving lower over time. It acts as a resistance level, where prices tend to drop.
Disclaimer:
I am not a SEBI registered. The information provided here is for learning purposes only and should not be interpreted as financial advice. Consider the broader market context and consult with a qualified financial advisor before making investment decisions.

Canara Bank Target 115 After a big fall in Canara Bank, a rise of 2 to 5 percent can be seen in one to two days. The stock will see targets of up to Rs 115 in the next week.


CANBK-SHORTTraders can consider SHRT positions on a confirmation from order flow with appropriate risk management strategies.

NIFTY AND BANKNIFTY VIEWHello Traders,
Checkout the latest update on Nifty and BankNifty. Hope you all safe funds
