CAPTRUST Approaching Trendline Breakout – Watch Closely"CAPTRUST Breakout: Strong Weekly Close & Trendline Retest!"
✅ 5 Touches on Trendline – Strong validation of the breakout zone.
✅ Weekly Close with High Volume – Indicates strong buying interest.
✅ 1-Hour Reversal Candle – Early confirmation of momentum shift.
CAPTRUST trade ideas

Capital Trust LtdCapital Trust Ltd
Incorporated in 1985, Capital Trust Ltd provides loans to Small and Micro Enterprises
Company is registered as a Systematically Important Non Deposit Taking Non Banking Finance Company. It used to provide consultancy services to foreign banks and later began offering business loans to micro entrepreneurs in rural India, particularly in smaller towns. These loans are given to low-income individuals running small businesses who may not have collateral or a credit history. Currently, company's digitized rural financing model offers quick digital micro loans to MSMEs and caters to over 70,214 customers across 96 districts through 306 branches in 10 states in India

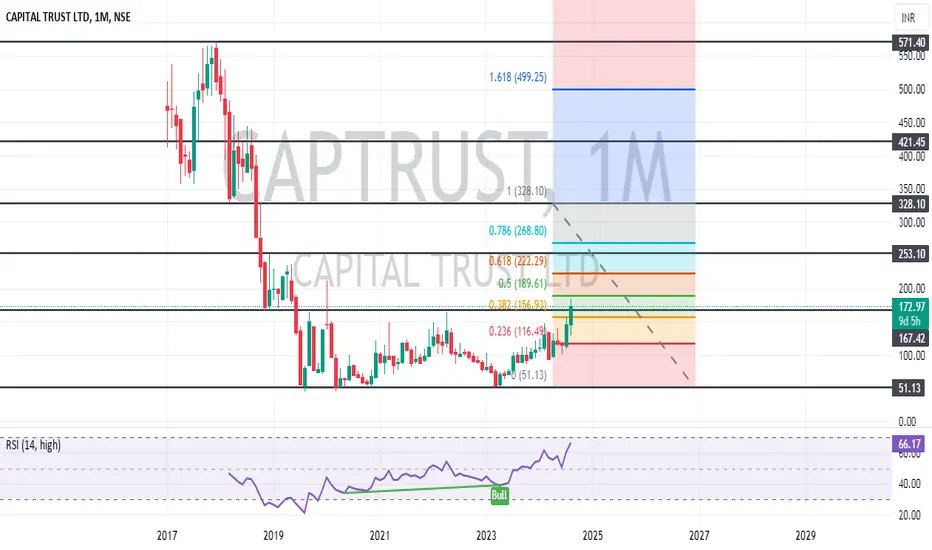
Technical Analysis of Capital Trust Ltd (CAPTRUST)Technical Analysis of Capital Trust Ltd (CAPTRUST)
Overview of the Stock:- The technical analysis on a weekly timeframe analysis of Capital Trust Ltd (CAPTRUST) on the National Stock Exchange (NSE) of India. The key indicators and patterns observed are:
1. Uptrend: The overall trend appears to be bullish, with prices consistently moving higher over the past few years.
2. Fibonacci Retracement Levels: The chart includes Fibonacci retracement levels, which are used to identify potential support and resistance areas. The 0.382, 0.618, and 0.786 levels are particularly significant.
3. Relative Strength Index (RSI): The RSI is a momentum oscillator that measures the speed and change of price movements. It is currently above 50, indicating a bullish trend.
4. Support and Resistance Levels: There are several horizontal lines representing support and resistance levels. These levels can provide clues about potential price reversals.
Potential Analysis based on Technical Indicators - Based on the chart, here are some potential interpretations:
Bullish Continuation: If the price remains above the 0.618 Fibonacci retracement level and the RSI stays above 50, it suggests a continuation of the uptrend.
Pullback: A potential pullback to the 0.382 or 0.50 Fibonacci retracement level could provide a buying opportunity for those who missed the previous uptrend.
Breakout: A break above the all-time high could signal a significant bullish breakout, leading to further price appreciation.
Remember: Technical analysis is a tool to help identify potential trading opportunities, but it does not guarantee future price movements. Always conduct thorough research and consider your risk tolerance before making any investment decisions.
Disclaimer: This analysis is based on the provided chart and is for informational purposes only. It does not constitute financial advice. Always consult with a financial advisor before making investment decisions. I am not SEBI registered person to suggest any stock and this is my personal opinion about the stock.
Thanks for your support as always
CAPTRUST - BUY ACTIVECAPTRUST- Capital Trust Limited - BUY ACTIVE
Chart Insights : Weekly Chart
Stock closed at 142 on 23-FEB-24
We can see stock is coming to break the resistance and can expect upside move if its sustain above the resistance.
BUY Active only on top of resistance , it may try to retest the same level in coming days , best buy on retest level & keep monitor for future investment.
Drawn support and resistance levels on chart for entry and exit reference.
Its Risky Investment , Invest less and wait for years. If it crosses 165 level and sustain we can see very good upside movement.

SHORT TERM OPPORTUNITY IN CAPITAL TRUST_35% UPSIDEOn a day where almost every stock seemed to tumble, CAPTRUST managed to pull off a bullish stunt. The stock closed with a +15% gain along side 15 times surge in daily volume.
The weekly chart of the stock shows us that the stock managed to pierce above an18 months old active supply zone.
Since Jul 2022 the stock has been attempting to move beyond the INR 110 mark but failing to do so.
For the past 4 months the stock had been trading in a tight range of INR 90-110 waiting for the right time to clear above 110 mark, which it did on Wednesday's session.(AND HOW!!)
What should now be expected from the stock is that it will now head towards the INR150-160 zone to test the new supply as the old supply zone has been successfully conquered.
CMP 113.15
SL 98
TARGET 155
RR 1:3


#CAPTRUST #NIFTY #BANKNIFTY #IoT #ML #CANDLESTICKS #TRADE ##CAPTRUST
Capital Trust Ltd.
CMP: 85.20 {Comment to know when to enter this trade!}
Target: 127 // 147 // 167
If u like my work, kindly LIKE SHARE & FOLLOW for latest stock recommendations.
