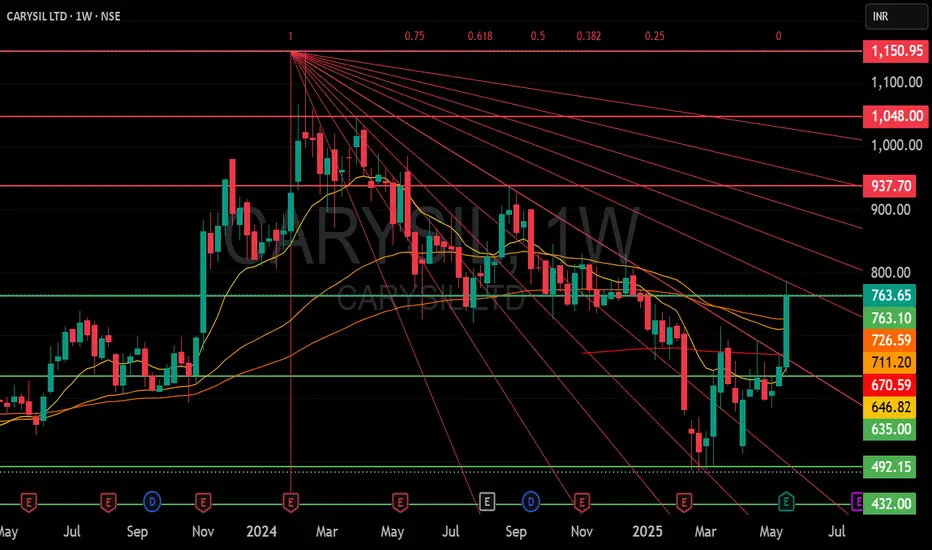
CARYSIL- LOOKS GOOD.Here's a detailed technical analysis using Elliott Wave Theory (EWT), Fibonacci, and volume/RSI interpretation for CARYSIL LTD (Weekly Chart):
🔍 Chart Analysis Summary:
1. Trend & Structure
A falling trendline was broken decisively with strong bullish candles and high volume—indicating a trend reversal.
The recent structure indicates a potential Wave 3 rally if we consider the Elliott Wave framework from the bottom near ₹431.
🌀 Elliott Wave Analysis (Probable Count)
Wave 1: Approx ₹431 → ₹730 (early 2024)
Wave 2: Correction from ₹730 → ₹520 (shallow, possibly zig-zag or flat)
Wave 3: Now ongoing, from ₹520 → ₹917+ (current high).
Wave 3 typically shows impulsive strength, supported here by volume and breakout behavior.
Wave 4 & 5: Yet to unfold; Wave 4 may likely consolidate near ₹820–850 before a final push toward ₹1000+ (Wave 5).
📐 Fibonacci Levels
Assuming:
Wave 1 = 431 to 730 = 299 pts
Projecting Wave 3 = 1.618 × Wave 1 = ~483 pts
From Wave 2 low (₹520) → Wave 3 potential target = ₹520 + ₹483 = ₹1003 (nearly tested)
Key Levels:
61.8% retracement of full fall (approx ₹1150 → ₹431) = ~₹900–920 zone (now reached)
Golden Ratio resistance in play
If this level is cleanly surpassed, next targets using Fib Extension:
1.618 of Wave 1 = ₹1000–1020
2.618 = ₹1150 (next major resistance)
📊 Volume & RSI Analysis
Volume Surge: Confirms institutional buying interest on breakout.
RSI: Near 69 (overbought zone), but typical of Wave 3. Not a sell signal yet, but keep watch for divergence.
RSI-based MA: Still lagging around 51—showing momentum has only recently shifted strong.
✅ Suggestions
Short-Term:
Some resistance near ₹920–940 likely due to previous swing highs and Fib zone.
Expect mild pullback/consolidation (possible Wave 4) before Wave 5 targets.
Medium-Term:
Hold with SL below ₹840 (previous breakout zone).
Watch for price-volume confirmation on any move beyond ₹950.
Fibonacci Retracement for Support:
Key pullback support zones: ₹850 / ₹800 (0.382 / 0.5 retracement of Wave 3).
📚 Learnings / Takeaways
Trendline + volume breakout with impulsive candles is a reliable Wave 3 signal.
Fibonacci extensions + RSI give confluence levels for Wave 3 exhaustion.
Don’t pre-empt Wave 5 without letting Wave 4 structure complete.
RSI divergence is often seen between Wave 3 and 5 (watch for this in the future).
CARYSIL trade ideas

CARYSIL LTD S/RSupport and Resistance Levels:
Support Levels: These are price points (green line/shade) where a downward trend may be halted due to a concentration of buying interest. Imagine them as a safety net where buyers step in, preventing further decline.
Resistance Levels: Conversely, resistance levels (red line/shade) are where upward trends might stall due to increased selling interest. They act like a ceiling where sellers come in to push prices down.
Breakouts:
Bullish Breakout: When the price moves above resistance, it often indicates strong buying interest and the potential for a continued uptrend. Traders may view this as a signal to buy or hold.
Bearish Breakout: When the price falls below support, it can signal strong selling interest and the potential for a continued downtrend. Traders might see this as a cue to sell or avoid buying.
MA Ribbon (EMA 20, EMA 50, EMA 100, EMA 200) :
Above EMA: If the stock price is above the EMA, it suggests a potential uptrend or bullish momentum.
Below EMA: If the stock price is below the EMA, it indicates a potential downtrend or bearish momentum.
Trendline: A trendline is a straight line drawn on a chart to represent the general direction of a data point set.
Uptrend Line: Drawn by connecting the lows in an upward trend. Indicates that the price is moving higher over time. Acts as a support level, where prices tend to bounce upward.
Downtrend Line: Drawn by connecting the highs in a downward trend. Indicates that the price is moving lower over time. It acts as a resistance level, where prices tend to drop.
Disclaimer:
I am not a SEBI registered. The information provided here is for learning purposes only and should not be interpreted as financial advice. Consider the broader market context and consult with a qualified financial advisor before making investment decisions.
Carysil: Carry on the growth?The counter has given a fair VCP pattern, we need a close above 702 to confirm the clear BO. This stock can make a good movement from there on, 1st easy target can be 820, but this may go well beyond it if market supports.


Good time to acummulate Carysil shareThis share looks bottoming out. It has a strong support as mentioned in the chart. High chances it flies back once the down trend is broken. So good time to start acummulating this share for short to mid term.


Carysil: Carrying investor up and upThe blast move is not done yet, it is here to go forward, we may see a pause and consolidation between 890 to 930 and then it again zoom till 1250.

wave III of 3 in CARYSIL...upside potential of 25%Carysil Limited, together with its subsidiaries, manufactures and trades in quartz kitchen and stainless steel kitchen sinks, bath products, tiles, kitchen appliances, and accessories in India.
The stock is seen making impulse waves to the upside since Jan 2023.
It made the first impulse (wave 1) from Jan. - April 2023. Wave 3 seems to have started off in May 2023 and is likely getting extended.
Wave I of 3 was formed between May and July 2023 and then there was a 75% retracement of wave I from July-oct.
Wave III of 3 has now kicked off and volume too is picking up. The projected target for this wave should be the 850-870 zone
SL 650
CMP 696
Target 860

Cup and Handle Breakout with Huge VolumeAfter correcting for 23month stock broke out with huge volume lead by decent results is good to add the stock to the watchlist. Good to enter after retest.

💥Carysil💥-Nice Breakout💥Carysil💥-Nice Breakout
Capital to be deployed- 20k
Investing Price -725-740
Breakout Price-717
Stoploss-592
Targets-945-1231-4201
RT for max reach
#CARYSIL #StocksToBuy #stocks #StocksToTrade #StocksInFocus #stockstowatch #StocksInNews

CARYSIL BREAKOUTBreakout in carsysil, keep the stoploss at 674 on daily closing basis, targets can be 700-750-800 in coming days,
STOCK FUNDAMENTALS:-
PE 39.50
MCAP 1789cr
ROE 15.35%

Resistance BreakoutPlease look into the chart for a detailed understanding.
Consider these for short-term & swing trades with 2% profit.
For BTST trades consider booking
target for 1% - 2%
Please consider these ideas for educational purpose
Comment below if you are looking for any answers

CARYSILSwing/Positional trading
CARYSIL breakout with good volume. Short and Medium term relative strength is good
Price is above all major Moving averages. Recently took support @30WMA
#Educational purpose only

Carysil Ltd Trend AnalysisThe only listed fundamentally sound small cap company in its segment for kitchen appliances and quartz kitchen sinks.
The company gets around 80% revenues from export markets and 73% of total revenues come from quartz sink.
The company is going for another 20% expansion by adding 1L units to cater the demand of global customers.
Price is making lower lows indicating bearish continuation, next support is around 350 level.
Good to accumulate around 320 - 380 level for the following targets:
Medium term swing target @ 800 (125% ROI)
Long term swing target @ 1100 (210% ROI)
Long term positional target @ 1500 (320% ROI)
Only concern is if the dollar index tumbles or supply chain disruption happens due to lockdown then this stock may underperform as majority of revenues come from export markets.
Do your own due diligence before taking any action.
Peace!!

CARYSIL BREAKOUT AFTER CONSOLIDATIONCARYSIL is on previous support and consolidated for a while and now given breakout . Can go up to or break through trendline.

Acrysil LtdThis chart is only for educational purposes and should not be considered for doing any buying and selling in this stock.

