Trendline Support - CCLCurrent Price: ₹841.75
Technical Analysis:
Trendline Pattern Support taken: The chart clearly shows CCL Products (India) Ltd. taking support from a long-term upward trendline. This is generally a strong bullish signal, indicating that the price has found a floor at this level and could potentially continue its long-term upward trajectory.
Target: Double or Multibagger stock: This implies a significant long-term increase in the stock price.
Time Frame: 1 Year to 3 Year (This suggests a medium to long-term investment horizon for this ambitious target).
Fundamental Analysis (Based on the provided images for CCL Products (India) Ltd.):
Market Cap: As of late May 2025, CCL Products (India) Ltd. has a market capitalization in the range of ₹10,000 - ₹11,000 Cr.
P/E Ratio: The P/E ratio for CCL Products generally fluctuates, but it tends to trade at a premium due to its strong market position in the coffee industry.
Quarterly Results (Q4 FY25 - ended March 31, 2025):
CCL Products recently announced its Q4 FY25 results. Consolidated Net Profit after tax for Q4 FY25 was ₹67.63 crore, showing a slight decrease compared to ₹75.64 crore in Q4 FY24.
Revenue from Operations for Q4 FY25 was ₹501.99 crore, which was also slightly down from ₹521.84 crore in Q4 FY24.
Yearly Results (FY25 - ended March 31, 2025):
For the full fiscal year FY25, consolidated net profit after tax was approximately ₹255 crore, compared to ₹277.6 crore in FY24.
Consolidated revenue from operations for FY25 was approximately ₹1,980 crore, down from ₹2,112 crore in FY24.
Corporate Actions:
Dividend: CCL Products has a consistent track record of paying dividends. For FY25, the company's board has recommended a final dividend of ₹2.50 per equity share.
Capacity Expansion/New Initiatives: The company has been in the news for its ongoing capacity expansion projects and initiatives, particularly in its instant coffee segment, aimed at driving future growth.
Company Order Book:
For a company like CCL Products, the "order book" is typically reflected in its long-term contracts and recurring sales with global private label clients. While specific order book values are not usually disclosed, the company's consistent revenue generation suggests stable demand for its products.
Latest News:
Q4 FY25 Results: The primary recent news revolves around their Q4 FY25 earnings, which showed a slight decline in both profit and revenue, primarily due to prevailing demand and pricing conditions in the international coffee market.
Capacity Expansion: Ongoing focus on the commissioning of new facilities and increased capacity, particularly for granular coffee.
Market Conditions: News related to global coffee prices, demand trends, and competitive landscape in the instant coffee market.
Overall Assessment:
CCL Products (India) Ltd. presents a mixed picture:
Technical Strength: The chart clearly shows the stock taking Trendline Support, which is a strong bullish technical indicator suggesting a potential rebound or continuation of its long-term uptrend.
Fundamental Headwinds (Recent): The latest quarterly and yearly results (FY25) show a decline in both net profit and revenue. This indicates some short-term challenges, likely related to market conditions in the coffee industry.
Long-Term Potential: Despite recent headwinds, CCL has a strong brand reputation, a significant presence in the global instant coffee market (especially in private labels), and a history of growth. Its ongoing capacity expansion is a key driver for future revenue.
Valuation: The stock generally trades at a premium due to its quality and market position.
The target of being a "Double or Multibagger" within a 1 to 3-year timeframe is ambitious. For this to be achievable, the company needs to demonstrate a strong turnaround in its profitability in the upcoming quarters, leveraging its expanded capacity and navigating the volatile coffee market successfully. The trendline support suggests a good entry point if the fundamentals begin to show a recovery.
Disclaimer: This analysis is for informational purposes only and does not constitute investment advice. Always conduct your own thorough research, carefully analyze the stock chart for the specific trendline support, assess your risk tolerance, and consult with a qualified financial advisor before making any investment decisions. The stock market carries inherent risks.
CCL trade ideas

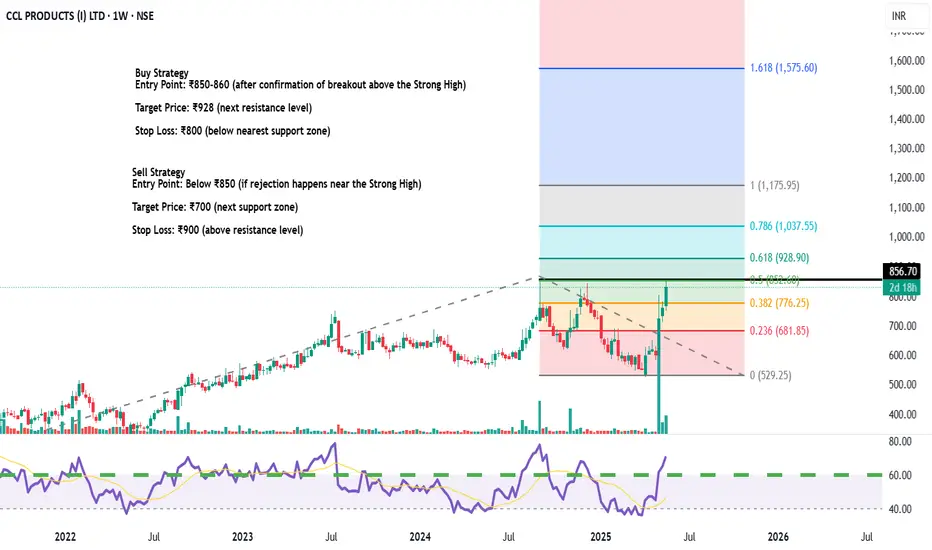
Massive Move Incoming? CCL PRODUCTS LTD Price Prediction!Trade Recommendation
Buy Strategy
Entry Point: ₹850-860 (after confirmation of breakout above the Strong High)
Target Price: ₹928 (next resistance level)
Stop Loss: ₹800 (below nearest support zone)
Sell Strategy
Entry Point: Below ₹850 (if rejection happens near the Strong High)
Target Price: ₹700 (next support zone)
Stop Loss: ₹900 (above resistance level)
Technical Observations
Resistance Zones: ₹900
Support Zones: ₹700
RSI: Check for overbought or oversold levels to confirm entry
CCL ProductCCL Products (India) Ltd reported a 56% surge in Q4 profit, reaching ₹101.9 crore, driven by strong export growth and a 15% rise in revenue

CCL Products (I) Ltd. (NSE) – Weekly ChartTechnical Summary:
Elliott Wave Structure:
The stock is currently in Wave 4 correction after completing Wave 3.
A Wave 5 uptrend is expected once the correction is complete.
Fibonacci Retracement:
0.5 level (~533.25) and 0.382 level (~605.00) are key retracement zones.
The price is near the 514.65 support, a critical zone for a reversal.
RSI Analysis:
RSI is at 36.41, indicating oversold conditions.
RSI moving average is at 47.50, suggesting weak momentum but potential for reversal.
Support & Resistance Levels:
Immediate Support: 514.65
Next Support: 347.30 and 227.38 (in case of further breakdown).
Resistance Levels: 605.00 and previous high of 855.00.
Suggestions & Possible Corrections:
✅ Bullish Case: If the price holds above 514.65, a potential Wave 5 rally could take the stock toward 800+ levels.
❌ Bearish Risk: If 514.65 breaks, the next strong support lies around 347.30.
Final Recommendation:
Monitor price action near 514.65; if it holds, a bullish move can be expected.
Wait for RSI to cross 50 for confirmation of trend reversal.
If price breaks below support, avoid long positions until a new base forms.

CCL: Brewing something?Looks like a reversal on chart, a falling wedge BO with good follow through Bar closing near the top of bar. to play a little safer, entry can be above 686. we can see a nice run!

CCL CCL
MTF Analysis
CCL Corp Yearly Breakout 572
CCL Corp 6 Month Demand BUFL 572
CCL Corp Qtrly Demand BUFL (in Process) 593
CCL Corp Monthly Demand 624
CCL Corp Weekly bufl 503
CCL Corp Weekly DMIP 584
CCL Corp Weekly DMIP 494
ENTRY 725
SL 700
RISK 25
Target 983
REWARD POINT 258
Last High 854
RR 10.32
RR 36%

CCL Products-Nice BreakoutCCL Products-Nice Breakout
Capital to be deployed -20k
Investing Price-776-790
Breakout Price -776
Stoploss -700
Targets -947-1200
#gujrat #maharastra #StockMarketindia #StockToWatch #StocksInFocus #stockstowatch #StocksToTrade
#cclproducts

Darvas Box Strategy - Break outDisclaimer: I am Not SEBI Register adviser, please take advise from your financial adviser before investing in any stocks.
Stock has given break out buy above the High and do not forget to keep stop loss best suitable for swing trading. Purchase missed by one day still can be purchased.
Be Discipline, because discipline is the key to Success in Stock Market.

Weekly Chart : CCL Products (ind)(Please see in Weekly Chart )
In Weekly charts CCL breaks 605 after April 2023 on news of Coffee prices zooming to life highs.
Hopefully we should see target
T1 of 621 .
Then if momentum remains strong, target T2 of 640

CCLDisclaimer:
Kind regards to all friends and members ,
Stock market investment is subject to 100% market risks. Our company is not a SEBI registered company. Please consult your financial advisor before investing. This is for learning and training purposes only. Market Traps administrators are not responsible for any financial gains or losses resulting from your decisions. You acknowledge that stock market investments are highly risky and that you understand the market risks involved. Hence any legal action is void.

CCLThats a lovely chart with complex corrections marking as per the EW to see the completion of wave 4 and looking impulse to start the minor wave of wave 5. Note this is purely for education purpose only of EW .

CCL: Coffee serious momentThe price is at the trendline which supported it for more than 10 months, if price respects this support, we may see rise again but breaking this support means a good fall in counter.

NSE:CCL Products - Updated chart key levels 🎚You can check the previous updates
CCL Products Ltd (CCL) is in the business of converting raw coffee beans into instant coffee granules/powder. The company is not only
India’s largest coffee processor, but it has the world’s largest single location plant and has top private label instant coffee manufacturers
across the globe as its clients. While prima facie it looks like a commodity conversion business, unlike tea or other commodities, coffee
processing is a specialist job as the flavour and consistency has to be maintained batch after batch irrespective of the input quality or
grade. Not many companies have been successful in doing this and hence, globally, coffee business has very little competition and high
profitability.
Worldwide CCL’s coffee is being consumed at the rate of 1,000 cups per second. CCL exports its processed coffee to more than 90
countries and supports more than 250 brands with sustainable supplies — both quality and quantity. CCL has on offer more than 1000
recipes for the clients to choose from. It has a combined state-of-the-art manufacturing capacity of 35,000 MTPA, which is spread over
Duggirala (Guntur District of AP), Kuvvakolli (Chittoor District, AP), Switzerland, and Vietnam. Having succeeded in placing their coffee on
the world markets, CCL launched its ‘Continental Coffee’ brand for the Indian market, which should act as a major growth catalyst, going
ahead. With the help of its rich experience in the international markets, it has developed 250+ blends, claiming they are superior to its
competitors’ blends

Tata consumer was in channel going to breakdown or breakouthello bro be ready for comment me for any stock analysis for me it free you have to just comment me name of stocks


CCL PRODUCTS CCL PRODUCTS - Mother candle formation
entry - weekly close above 572
Target - 2x, 3x
SL - Range bottom


CCL Products Positional Upside IdeaAs per my analysis, best level to take upside entry on NSE:CCL is 488 with stop loss of 475 (13 Points)
Can hold long for targets of 498, 506, 515 & 526.
Note: This is my personal analysis, only for learning. Thanks.
About CCL Products (India) Limited ::::
CCL Products (India) Limited manufactures, trades in, and sells instant coffee and coffee related products in India. It offers spray dried coffee powder and agglomerated coffee, freeze dried coffee, freeze concentrate liquid coffee, roast and ground coffee, roasted coffee beans, and premix coffee. The company provides its products in various packs, such as jars, cans, pouches/sachets, big bags, bulk boxes, and drums under the Xtra, Speciale, Freeze Dried, Malgudi, and THIS brands. It also exports its products. The company was incorporated in 1961 and is based in Hyderabad, India.

Ccl Products (india) LimitedCcl Products (india) Limited
all levels given in chart,
do ur own analysis,
trade based ur own risk and reward...

CCL Products: Strong breakout stock!CCL products is a potential strong breakout stock. Keep it on your watchlist!

#CCL #Bollingerband #Priceaction CCL Product {240 mins}: This Bollinger band squeeze is ready to fire... Awaiting a TL BO too. All oscillators are indicating positive price momentum ahead. Keep tight SL of 240 on closing basis. Appears a low risk trade.

CCL: what is brewing?A close above 424 will open the gates to ATH, if results support (not very bright chance), we can see big move.

Fibonacci & previous support and resistanceCCL stock had taken support below Fibonacci level 0.618 and now it has crossed below Fib level 0.5, looks like it will again take support here and hit target of 430 in coming days.
