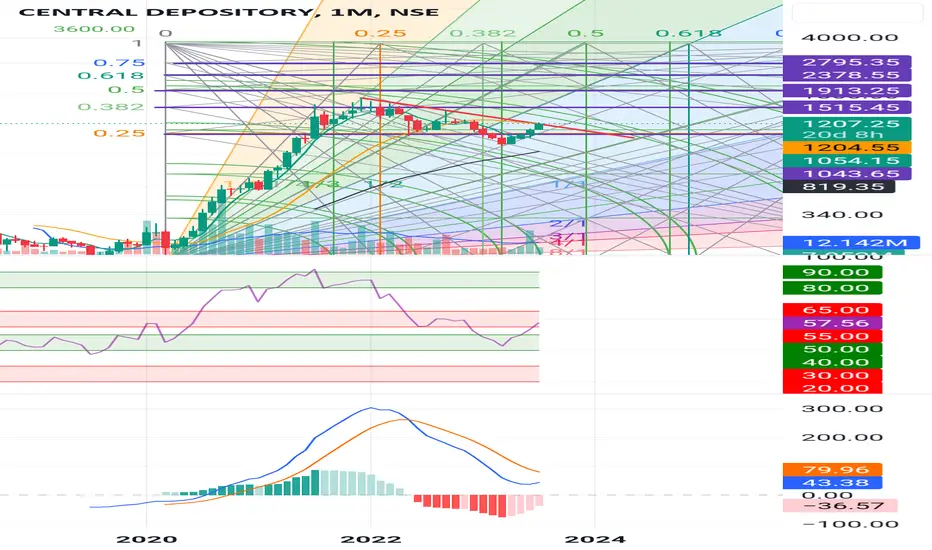
Cdsl may test 1600Good volume
Fundamentally very good .
September quarter is very impressive
Technically crossed resistance
Can test 1600 levels..
Strictly maintain stop 1200..
CDSL trade ideas

LONG #CDSL CDSL breakout of range with volume good sign to go long, if market supports this can easily get to 2:1 RR.

CDSLChart looks good to hold positionally
DISCLAIMER: NOT BUY/ SELL RECOMMENDATION
Sharing my views only

CDSL BROKEN OUT OF RANGE STOCK @ 20 DAYS HIGH CMP@1430CDSL After a long consolidation broken out of range.surpasses previous swing high of 1425.all technical parameters strong buy.

SWING TRADING CDSL trading at the neck line of weekly resistance zone with a huge gap up near abt earning day displayed good strength for long side once it closes abv 1430 with a strong bullish candle by breaking strong weekly resistance as well as strong trend line for the target of 60%


CDSLSuch a beautiful chart
looking to form rounding bottom
keep position as it is & add more when it comes down

CDSL1.50 moving average upside
2.volume increase
Target -1389
These are swing idea's which you can add your watchlist and analysis for yourself.
Keep on radar.
Potential upside stock!
This content for only education purpose!
I am not SEBI Register.

CDSLCMP 1282
Looks bullish
Strong breakout
Good Volumes
Bullish structure, HH, HL
Triangle break out
Targets 1450/1600++

Reversal Stock #CDSLRise in price with volume in #CDSL this past week after taking support of same descending trendline on which breakout was done after double bottom.

CDSL BREAKOUT SuccessfulCDSL has given the breakout you can buy it. it's forming CUP and Handle Pattern.
once can buy it as swing trade
Reason :
Successful breakout of the zone.
RSI > 50 Bullish Zone Incressing momuntum.
Very nice Volume in the stock for today.
Good consolidition of more than 1 year.
Price > VWAP that shows the bullishness.
Verdict :
Breakout successful, Strong bullish momentum
Plan of Action :
You can buy this at current price.
Buy price: 1267.50
Stoploss: 1216
Target : 1426

Cdsl for profit and investment Cdsl is a big name in market. Retesting the support and moving up.looks good to enter here. Targets plotted. Sl 1050

CDSL prediction Making a prediction on CDSL
I Feel CDSL will form a cup with handle pattern and reach its target of 1626.
It has posted highest ever revenue and profits.
I have mentioned my buy and sell price.
PS:Not a recommendation to buy or sell


CDSL - CUP FormattionCertainly! Imagine you're observing the behavior of a stock called CDSL in the stock market. Just like a skilled artist shapes clay into a cup, the stock's price chart has formed a pattern resembling a cup. This is a technical pattern that traders often look for, as it can provide insights into potential future movements.
As you look at the chart, you notice something interesting happening. After forming the cup, the stock's price has started to create what traders call a "handle." Think of this handle as the part of the cup that you would hold onto – it's a smaller consolidation of price that occurs after the cup has been shaped.
What's particularly intriguing is that this handle is taking the form of an "ascending triangle" pattern. Visually, this pattern looks like a triangle with a flat upper boundary that's sloping upwards. It's as if the stock is gathering energy within this triangle, getting ready for something exciting.
Now, here's where the excitement builds. Traders are noticing a couple of key things happening simultaneously. First, the "weekly RSI" – a tool that helps gauge the stock's momentum – is on the rise. It's like the heartbeat of the stock is getting stronger each week, indicating increasing interest and potential upward movement.
Second, there's a surge in trading volume accompanying this pattern. This tells us that more and more investors are becoming involved, making the stock's movements even more significant.
So, what does all of this suggest? Well, if we connect the dots, it seems that all these elements are coming together like instruments in a symphony, building up to a crescendo. The anticipation is that a "breakout" is on the horizon.
A breakout is when the stock's price bursts through a certain level, often signaling a shift in its trend. In this case, considering the pattern and the supporting factors, traders are speculating that the breakout will be upwards.
What might the target of this potential move be? The pattern provides a clue. Traders often measure the "height of the cup" – that's the distance from the bottom of the cup to the top rim. This measurement is then projected from the breakout point to estimate a potential target.
However, it's important to remember that the world of stock trading is complex and filled with uncertainties. This observation is like looking at a constellation in the night sky – it suggests patterns, but the actual movement is influenced by various factors.
So, in summary, traders are excitedly watching CDSL. The chart resembles an artistically crafted cup with a handle. The handle is forming an ascending triangle, and the increasing weekly RSI and trading volume suggest a buildup of potential energy. It's as if the stock is preparing for a dramatic scene – a breakout – and if everything aligns, the target could be the height of that cup. But as a wise disclaimer, this observation isn't financial advice; it's more like marveling at the artistry of the market's movements.

CDSL - Long Journey Certainly! An ascending triangle pattern seems to be forming in CDSL's chart, hinting at a potential breakout on the horizon. Here are the key points in a concise and visually appealing way:
1. Ascending Triangle Formation : CDSL's price chart showcases a clear ascending triangle pattern. This pattern is characterized by higher lows forming a rising support line and a horizontal resistance line at the top.
2. Breakout Anticipation: The converging lines of the ascending triangle suggest a potential breakout in the near future. As the price approaches the apex of the triangle, traders are eagerly awaiting a decisive move.
3. Consistent Support: The rising support line underscores the consistent buying interest, indicating that traders are showing willingness to buy at higher prices. This pattern could signify growing confidence in CDSL's potential.
4. Increasing RSI : The Relative Strength Index (RSI), a momentum oscillator, is on the rise. This indicates strengthening buying momentum and suggests that the stock might have room to move higher before becoming overbought.
5. Volume Confirmation : The increasing volume accompanying the ascending triangle adds significance to the pattern. Rising volume during the formation validates the potential breakout, implying heightened trader interest.
6. Impending Breakout : With the ascending triangle nearing its apex, a breakout becomes imminent. This could trigger a noteworthy price movement, potentially in the direction of the breakout.
Remember, while these patterns provide insights, it's important to consider other factors before making trading decisions. Technical patterns, like the ascending triangle, offer valuable hints, but combining them with fundamental analysis and risk management is key. This information is shared for educational purposes and is not financial advice.

CDSL : Expecting a sell offSince the market is in a overvaluation and has given a good enough rally, there is a high probability for a reversal and a range formation in the near future. This may be due to profit booking or any other unforeseen event.
But CDSL is kind of correlated with the overall market movement since there business model depends on it.
So I'll look for an entry when price reaches the low of the channel, depending on the fundamentals and macro economic situation at that time and also the fundamental and technical situation of the company.

CDSLCDSL looks good as it crosses monthly 20 SMA and about to break the flag resistance.
Also, the previous week candle closing above weekly 50 SMA.
MACD cross over also being done.
CDSLCDSL for SWING TRADE
entry in green zone only, seems good for Long from here.. Target, SL clearly given in chart
***I am not SEBI Registered. All my charts and analysis are only for educational purpose not for trading purpose.

CDSL - Finally coming out of the woodsThe stock has been in a down trend for nearly 18 months. It has been moving is a wide downward channel. Now after recovering from the bottom of the channel . making higher highs,
consolidated for some time around the 30 week moving average and moved past the 200 ema.
Now attempting to move out of the channel. Good volume support is seen. Relative strength, Money Flow and Buying Pressure are turning positive. Looks like the the stock is finally out of the woods and could move up.

CDSL 16% upside potential CDSL 16% upside potential in short term.
The view is for educational purpose only.

CDSL long above 1160 Closing BasisThe stock started moving from lower levels with good candle followed by the volumes, 1160 can be the falling trendline resistance so buy once the resistance sustain, for 1270 and 1420 as targets

"CDSL"Cdsl can show a good moov form here as crossing a major hurdle 1080 of last one year...
Cmp 1091,
SL 1055,
target1 1160, target2 1290
