CENTENKA trade ideas
CENTURY ENKA LTD S/RSupport and Resistance Levels:
Support Levels: These are price points (green line/shade) where a downward trend may be halted due to a concentration of buying interest. Imagine them as a safety net where buyers step in, preventing further decline.
Resistance Levels: Conversely, resistance levels (red line/shade) are where upward trends might stall due to increased selling interest. They act like a ceiling where sellers come in to push prices down.
Breakouts:
Bullish Breakout: When the price moves above resistance, it often indicates strong buying interest and the potential for a continued uptrend. Traders may view this as a signal to buy or hold.
Bearish Breakout: When the price falls below support, it can signal strong selling interest and the potential for a continued downtrend. Traders might see this as a cue to sell or avoid buying.
MA Ribbon (EMA 20, EMA 50, EMA 100, EMA 200) :
Above EMA: If the stock price is above the EMA, it suggests a potential uptrend or bullish momentum.
Below EMA: If the stock price is below the EMA, it indicates a potential downtrend or bearish momentum.
Trendline: A trendline is a straight line drawn on a chart to represent the general direction of a data point set.
Uptrend Line: Drawn by connecting the lows in an upward trend. Indicates that the price is moving higher over time. Acts as a support level, where prices tend to bounce upward.
Downtrend Line: Drawn by connecting the highs in a downward trend. Indicates that the price is moving lower over time. It acts as a resistance level, where prices tend to drop.
Disclaimer:
I am not a SEBI registered. The information provided here is for learning purposes only and should not be interpreted as financial advice. Consider the broader market context and consult with a qualified financial advisor before making investment decisions.

50 SMA Rising - Swing TradeDisclaimer: I am not a Sebi registered adviser.
This Idea is publish purely for educational purpose only before investing in any stocks please take advise from your financial adviser.
50 SMA Rising strategy. Suitable for Swing Trading Initial Stop loss lowest of last 2 candles and keep trailing with 50 days SMA if price close below 50 SMA then Exit or be in the trade for 2 to 4 weeks.
Target & Stop loss shown on Chart. Do not Forget to Exit if Stop loss Hit.
Be Discipline because discipline is the Key to Success in the STOCK Market.

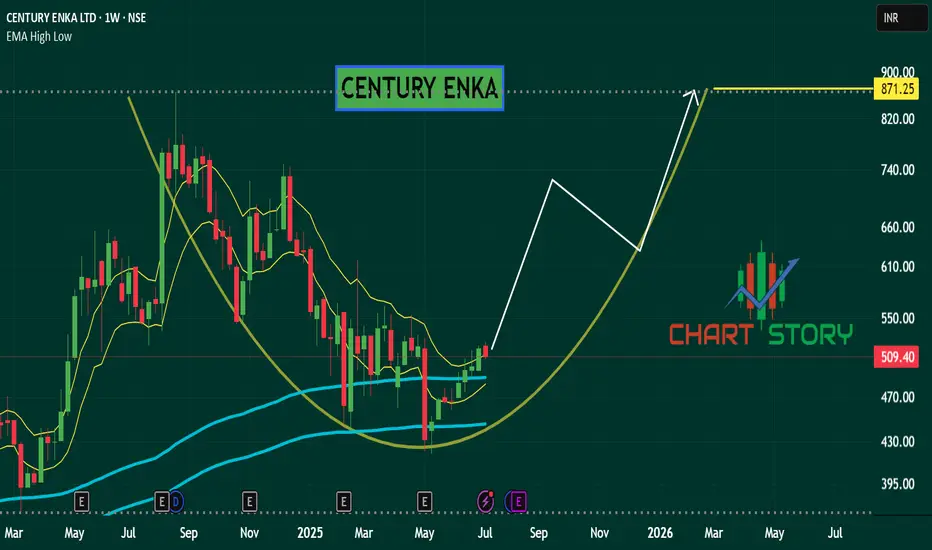
CENTENKA - Bullish SetupStock name - Century Enka Limited.
Weekly chart setup
Chart is self explanatory everything.
Master score - B
Disclaimer : This is for demonstration and educational purpose only. This is not buying or selling recommendations. I'm not SEBI registered.

Positional trade setup for Century Enka LtdStock: Century Enka Ltd
Current Price: 776
Stop Loss: 634
This suggests a bullish outlook.
Potential Positional Trade Idea
Long Position:
Rationale: The wide stop-loss indicates a strong conviction in the upward movement of the stock. Given the current price of 776 and a stop-loss of 634, there's a significant potential upside.
Target: Determine potential targets based on technical analysis (like resistance levels, Fibonacci retracements, etc.) or fundamental analysis (like earnings estimates, industry trends).
Risk Management: The stop-loss of 634 is already in place. Consider additional risk management strategies like trailing stop-loss or position sizing.
Essential Considerations
Technical Analysis: Conduct a thorough technical analysis to identify potential support and resistance levels, trendlines, and chart patterns.
Fundamental Analysis: Evaluate the company's financial health, industry trends, and competitive landscape.
Risk Tolerance: The chosen stop-loss indicates a high-risk appetite. Ensure this aligns with your overall investment strategy.
Diversification: Consider diversifying your portfolio to manage risk.
Additional Information Required
Investment Goals: Your overall investment objectives (income, growth, or preservation).
Risk Profile: Your tolerance for risk.
Remember: The stock market is volatile, and past performance is not indicative of future results. Always exercise caution and do your own due diligence.

Cup and handle pattern breakoutGood volume buildup in daily as well as in weekly timeframe.
Cup and handle pattern breakout with good volume.
Smallcap⚠️⚠️
QOQ sales are up.
Fundamental's are OK.
FII & DII stakes are up significantly.
NOTE: I do my analysis, do your before trade.

CENTENKA1. Anything can happen.
2. You don't need to know what is going to happen next in order to make money.
3. There is a random distribution between wins and losses for any given set of variables that define an edge. No other thoughts
4. An edge is nothing more than an indication of a higher probability of one thing happening over another.
5. Every moment in the market is unique.

Century Enka LongTwo Years Breakout
Swing Trading Setup
Very Big Weekly Closing with Very High Volume


simple 2 Year Consolidation 1D TF Morning starsimple U cup shape pattern, in 2 year consolidation.
in Higher TF 18 year consolidation and current day is retracement zone. in 1 D TF morning star pattern

CENTENKA in Bullish trend Entry at 428
Sl at 412
Target 491
Take a look at 491 level and then you can extend your target


Inverse head and shoulder pattern... Ready to give breakout... The stoc is ready to give a inverse head and shoulder pattern breakout

CENTURY ENKA SWING TRADE SETUP BY TWJ1st Target 580 and 2nd target would be of new lifetime high if it crosses and sustains above 595 level
Buy at current market price & average if it reaches 550

century enka box breakoutmulti year breakout
fundamental stock, PE only 7 , intrinsic value750
for education purposes only

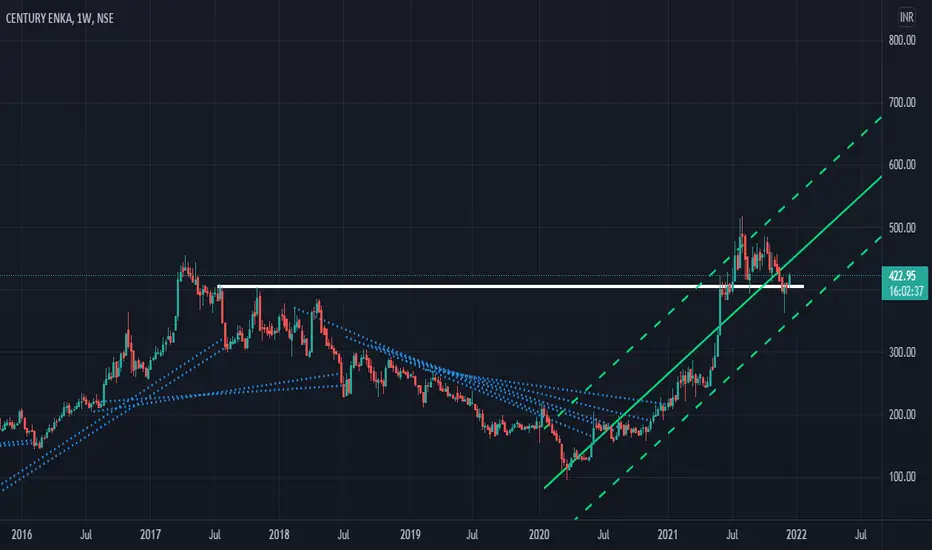
CENTURY ENKA retest donecentury enka at an important level, uptrend channel, bounces back after retesting resistance cum support level on weekly charts.
strong bookvalue of 498 and intrinsic value of 720
for education purpose only.
century enka - nested cupcentury enka price increases by Rs. 89 , every time the nested cup high is broken


weekly and daily breakout price has formed flag pattern and broke daily & weekly resistance with wide spread and volume. we have seen narrow spreads of bears also. looks bullish

century enka positional buycentury enka showed excellent rally and from last three days an excellent consolidation forming pole & flag pattern on 4H chart patterns. breakout will attract immediate target of 420 on downside 372 is important retracement level.after 420 another attractive level is 450.


BreakoutBreakout + Demand and Supply
> Not a high probability trade but high RR ratio.
> Twizzer Candle Pattern in Day tf

