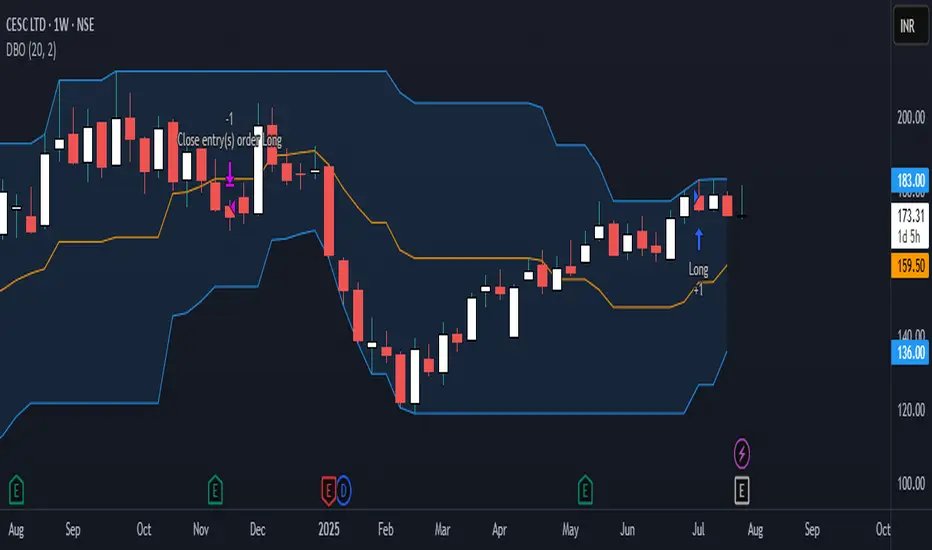
CESC looks strong if holds 160 levelsCESC looks strong if holds 160 levels
technically it look strong despite weak market sentiments
stocks revenue is also increasing
CESC trade ideas
Review and plan for 2nd July 2025 Nifty future and banknifty future analysis and intraday plan.
Swing idea.
This video is for information/education purpose only. you are 100% responsible for any actions you take by reading/viewing this post.
please consult your financial advisor before taking any action.
----Vinaykumar hiremath, CMT

CESC Ltd – Short-Term Breakout Idea|Target: ₹171.00 CMP: ₹165.70
Recommended Buy Range: ₹164.50 – ₹165.00
Target: ₹171.00 🎯
Stop Loss: ₹161.50 🛡️
Timeframe: 15 min & 1H
Risk-Reward: ~1.4:1
Type: Momentum Breakout / Swing Trade
🔍 Technical Analysis:
✅ EMA Cross (9/13) bullish crossover
✅ Price trading above EMA-26
✅ RSI at 65 – bullish, not overbought
✅ BB %B around 1.0 – strong upper band breakout
✅ Volume spike supports the move
Watch for a strong close above ₹167 to confirm momentum toward ₹171.
For Education Purposes Only

CESC SHORT TERM VIEWCESC is looking positive on charts for the short term, 153 being a strong support. On the downside, we can expect CESC to remain positive for some time, and expected resistance on the charts is placed at around 185 and 190 zones. All levels are marked in the chart posted.
NOT A BUY/SELL RECOMMENDATION.

CESC - SELLNSE:CESC Weekly channel breakdown with retest and seller clearly indicates trend change behaviour on chart.

CESC BULLISH TRENDCesc treded 10 & 20 days moving average above, & today break out 160,
Buy 162
Sl 158
Target 175,
If tomorrow 2 hrs candle positive close ,the take trade.

CESC --> Round bottom, No entry yet :/I see a bottom but since 2 months these guys dont really work also no breakout so no entry
(btw is it just me or is their logo the usb symbol?)

CESC Trading Within Demand ZoneCESC is currently trading at ₹154.07, slightly above the demand zone spanning ₹153.7 (baseHigh) to ₹150.8 (baseLow), established on 26th June 2024. This zone could serve as a support area, providing opportunities for buyers to enter the market.
Disclaimer: This analysis is for informational purposes only and should not be considered financial advice. Please conduct your own research or consult a financial advisor before making any investment or trading decisions.

Positional trade setup for CescObservations:
Resistance Breakout: CESC has broken above the horizontal resistance zone around ₹200-206, which it tested multiple times in the past. This breakout indicates bullish momentum.
Strong Volume: The price increase is accompanied by strong buying pressure, suggesting that the breakout may be sustained.
Trade Setup:
Entry:
Aggressive Entry: Buy around the current price of ₹206-208, as the stock has already broken the resistance.
Conservative Entry: Wait for a pullback to the ₹200-205 range, where the stock might retest the breakout zone before resuming its upward move.
Target:
First Target (T1): ₹225-230, based on the previous swing highs and projected move after the breakout.
Second Target (T2): ₹250-260, if the momentum continues and the broader market remains supportive.
Stop Loss:
Place a stop loss at ₹185, below the previous consolidation zone, to avoid being caught in a false breakout.
For a more conservative approach, you can place the stop loss slightly below ₹190, just below a recent low point.
Timeframe:
This is a positional trade, so it could take several weeks to months for the targets to be achieved, depending on the market conditions.
Risk Management:
Position Size: Keep the position size moderate to account for volatility. Use proper risk management, limiting losses if the breakout fails.
Trailing Stop Loss: Once the stock reaches ₹220, consider moving your stop loss to ₹200-205 to lock in some gains. Similarly, if the stock reaches ₹230, move the stop to ₹210.
Summary:
Entry: Buy around ₹206-208 (aggressive) or wait for a pullback to ₹200-205 (conservative).
Stop Loss: ₹185 (aggressive) or ₹190 (conservative).
Targets: ₹225-230 (T1) and ₹250-260 (T2).
This trade idea capitalizes on the breakout above a major resistance level, indicating further upside potential if the trend holds.

Technical Analysis of CESC Ltd Bullish after Short RetracementTechnical Analysis of CESC Ltd
Overview of the Stock - The provided chart depicts the 1-hour timeframe of CESC Ltd stock on the National Stock Exchange (NSE) of India. The analysis is based on the following technical indicators:
Candlesticks: These represent price action over a specific period.
Moving Average (EMA): A type of average that gives more weight to recent prices.
Fibonacci Retracement Levels: These are used to identify potential support and resistance levels based on the previous price movement.
Buy Zones: These are areas where the analyst suggests buying the stock.
Technical Analysis based on Price Action: - The stock price has been trending downwards, but it seems to be finding support near the 183.58 level (EMA 200). A break below this support level could signal further downside.
Fibonacci Retracement Levels: - The 0.618 retracement level at 196.49 is acting as a resistance. If the price breaks above this level, it could indicate a bullish reversal. The 0.786 retracement level at 192.80 is another potential resistance.
Buy Zones: With the help of technical analysis, we identified two buy zones:
Buy Zone 1 between 174 to 187: This is a wider range where buying is suggested.
Buy Zone 2 Above 174.53: This is a more specific level where buying is recommended.
Overall Outlook: - The stock is currently in a downtrend. A break above the 0.618 Fibonacci retracement level could signal a potential reversal. The buy zones identified might offer buying opportunities if the price reaches those levels.
Key Points to Consider
Risk Management: Always use appropriate risk management techniques when trading, such as stop-loss orders.
Fundamental Analysis: While technical analysis can provide insights, it's also essential to consider fundamental factors like company earnings, industry trends, and economic indicators.
Market Conditions: The broader market environment can significantly impact individual stocks. Be aware of overall market trends.
Note: This analysis is based on the information available in the technical analysis. Market conditions can change rapidly, and it's always advisable to stay updated with the latest news and developments.
Disclaimer: This analysis is based solely on the provided chart and does not constitute financial advice. Always conduct your own research or consult with a financial advisor before making investment decisions. Please do your own research before buying this stock as I am not SEBI registered person and we are not responsible for your loss. This analysis is my personal opinion based on technical analysis just for education purposes.
Thanks for your support as always

Darvas Box Strategy - Breakout StockDisclaimer: I am Not SEBI Register adviser, please take advise from your financial adviser before investing in any stocks.
Stock has given break out buy above the High and do not forget to keep stop loss best suitable for swing trading. Target 1: 1 - 298.
Be Discipline, because discipline is the key to Success in Stock Market.
Trade what you See not what you think.

Technical Analysis of CESCTechnical Analysis of CESC
The technical analysis of CESC Ltd., a company listed on the National Stock Exchange (NSE) of India. The chart shows the price action of the stock over a period of several weeks, along with various technical indicators.
Technical Indicators:
Fibonacci Retracement Levels: These are horizontal lines that indicate potential support or resistance levels based on the Fibonacci sequence. The levels are labeled as 0.0%, 0.236, 0.382, 0.5, 0.618, and 0.786.
RSI (Relative Strength Index): This is a momentum indicator that measures the speed and change of price movements. It is displayed in a separate chart below the main price chart. The RSI ranges from 0 to 100, with readings above 70 generally indicating overbought conditions and readings below 30 indicating oversold conditions.
Trade Recommendations:
Buy at CMP@186: This recommendation suggests buying CESC Ltd. stock at the current market price (CMP) of 186 INR.
TP1 above 192: This is the first target price for the trade, which is above 192 INR.
TP2 above 208: This is the second target price for the trade, which is above 208 INR.
Disclaimer:- This is not an investment advice but my personal opinion about the stock because I am not SEBI registered person to suggest any stock to buy or sell. Do your on research before buying this stock
Thanks for your support as always

50 SMA Rising - Positional TradeI am not a Sebi registered adviser.
This Idea is publish purely for educational purpose only before investing in any stocks please take advise from your financial adviser.
It 50 SMA Rising. Suitable for Positional Trading Initial Stop loss lowest of last 2 candles and keep trailing with 50 days SMA if price close below 50 SMA then Exit or be in the trade some time trade can go for several months.

CESC potential breakout Out of the base / Base on Base setup
High relative strength
VCP formation
Low risk entry

CESC = CLASSYIncorporated in 1978, CESC Ltd is in the business of generation and distribution of Electricity
What a classy setup for the Bull run ahead

CESC - BREAKOUT STOCK TO BUY FOR SWING TRADINGSUPPLY ZONE & BREAKOUT STOCK
Breakout point - 150
ENTRY - 150
SL - 140
TARGETS - 180
Disclaimer - All information on this page is for educational purposes only,
we are not SEBI Registered, Please consult a SEBI registered financial advisor for your financial matters before investing And taking any decision. We are not responsible for any profit/loss you made.

CESC bullish; above 144 ? - Monday 22-Apr.The above information does not constitute investment/trading recommendation and it is purely for educational purpose. Please check the Strategy below...
SWING Trading Strategy:
Position is created, only upon stock closing above the entry price on day closing basis and is held on for 5-10 trading sessions for larger gains (5-10%)
INTRADAY Trading Strategy:
1) Impulse upmove stage: The strong upmove (nearly upto 2% from breakoutprice) happens within five to 15 minutes. "High Risk Traders" buy in hope of another 2% upmove intraday.
"High Risk Traders" patiently wait through the Pullback-Consolidation stage to realize profits. High risk/High reward set up as breakouts may fakeout (reversal)also
2) Pullback-Consolidation stage: After the above "Impulse upmove stage"; the price may then pull back and move sideways (between "Open" price and "High" of the above "Impulse upmove stage").
Safe traders with minimum risk profile wait for a breakout from the consolidation to enter at this stage to relize high profits in the final intraday final "Breakout continuation" stage
3) Breakout continuation: Stocks often in the third stage breaks up above the "High" of the first "Impulse upmove stage" and continue to go higher again.
Both Safe Traders/High Risk Traders book profits at this stage
This do not constitute, financial, investment, trading, or other types of advice or recommendation.

CESCCESC shows good relative strength in this type of stock. I am willing to take a big position with a small stop loss

CESC HEADING TOWARDS 154 ??cess is in tight range after a uptrend
stock is in good volume collection and getting it self ready for next move towards the 154 levels which is 13-14% from current levels
retest zone marked and all target and levels also on chart

CESC BREAK OUTCESC Channel break out@117. Multi year break out seen recently. Power stocks are also buzzing.

CESCClean breakout in #CESC, Traders should look for long opportunities in the stock. Investors can add the stock at multiple entry levels.
S1- 102
S2- 95
S3- 92
Below 92, investors should look to exit the stock and book Loss!

CESC WEEKLY CHARTCESC WEEKLY CHART
Cmp 96.10 Breakout @ 95 Support @ 80 Target @ 126
This stock has witnessed a swing breakout @ 95 levels, as marked by ellipse.Target projected is placed @ 126 levels.
Its only an observation & not any suggestion.

CESC 250 Bullish multiple chart patternCESC 250 ++ Bullish multiple chart pattern
1) long term bullish pennant chart pattern they are up side chart moving target 450 to 500.
1) short term they are cup and Handel bullish chart pattern the are 250 target
the are technical analysis for the according to chart pattern
but other one is fundamental are very strong because a power sector a very very bullish in till 2030 to good investment opportunity
