CHAMBAL FERTILISERS LTD – Potential Bottoming Out‽CHAMBAL at Demand Zone | Volumes story
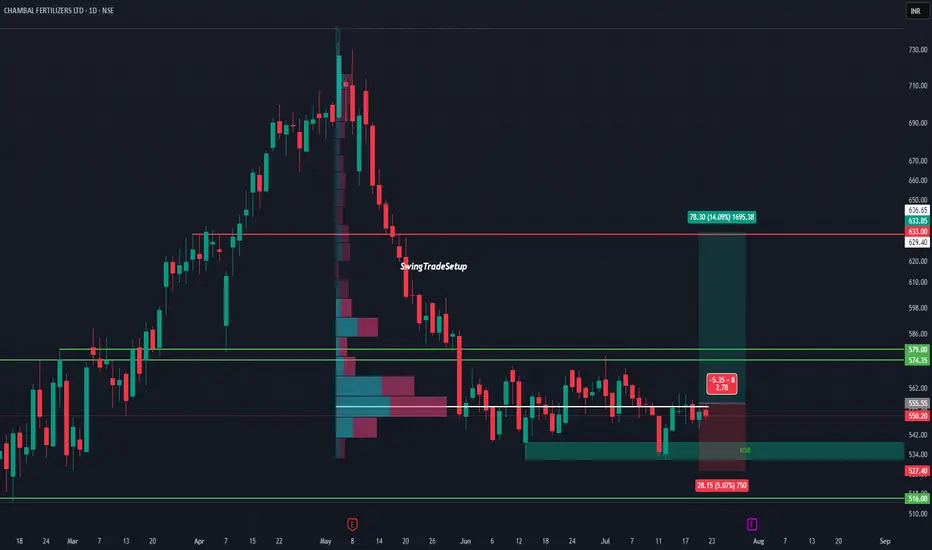
After a steep fall from 730 to 516, Chambal is now consolidating in a critical demand zone backed by visible volume activity. This range has previously triggered price reversals, and now history might repeat.
The stock is respecting the support between 527–516, forming a potential base. On the upside, a clean breakout above ₹555.55 can unlock a near-term target of 633+, a move of over 14%.
The risk-to-reward ratio remains attractive with a tight invalidation below ₹527, while the volume profile suggests accumulation in this range.
Technical View :
• Major support: ₹516–527
• Breakout trigger: ₹555.55
• Upside target: ₹633–636
• Risk below: ₹527
• Volume profile: Dense node suggests buyer interest
Valuation :
• PE: ~10.3 (undervalued vs peers)
• Dividend Yield: ~6.5% (steady income potential)
• Promoter Holding: 60.62% (strong & stable)
• No recent equity dilution
• DII/FII: Activity neutral, could turn if technical align
A good mix of fundamentals, attractive valuation, and technical structure makes this a stock to keep an eye on. If it crosses ₹560 with volume, it may kick off a short-term trend reversal.
This chart is for educational use only and not a buy/sell recommendation.
CHAMBLFERT trade ideas
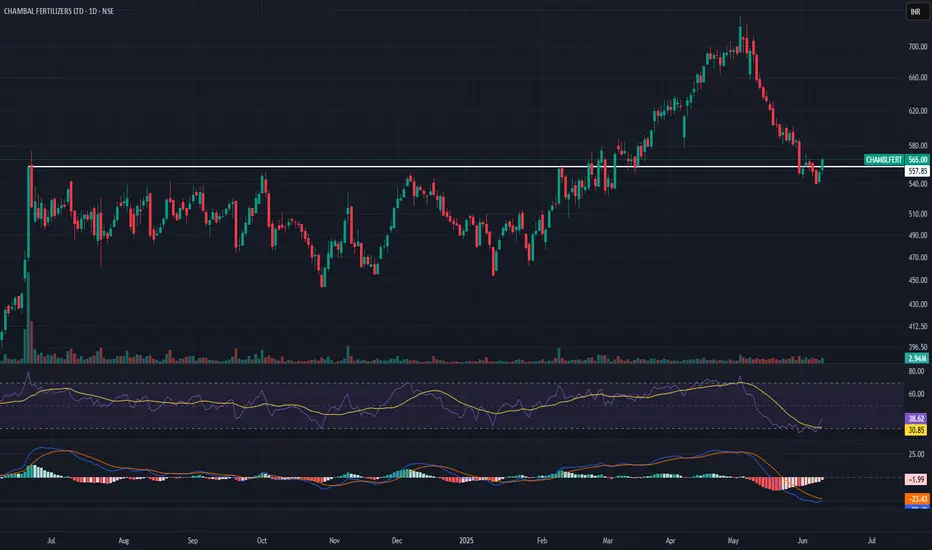
Reversal Trade in Chambal Fertilizers1. RSI is oversold
2. MACD just about to turn green
3. Previous resistance after breakout is now acting as support
CHAMBAL FERTILIZERS FOR SWING TRADECHAMBAL FERTILIZERS a good opportunity for swing trade plan, entry and exit point mention, add your watchlist and observe.
This is for Education purpose only...

CHAMBLFERT 1H Chart Analysis📉 CHAMBLFERT 1H Chart Analysis – Potential Breakdown Ahead
📅 Date: 7th June 2025
📊 Current Trend: Bearish continuation forming
⸻
🔍 Key Observations:
• 📌 Price: ₹539.90
• 🔻 Recent Drop: -2.27% today
• 🟩 1H FVG (Fair Value Gap): Indicates minor supply; price struggling to reclaim
• 🟥 30M FVG Above: Larger supply zone near ₹569.55, likely to act as strong resistance
📉 Bias:
Market structure shows weakness. If the price fails to reclaim the 1H FVG, further downside is likely.
🔽 Next potential targets: ₹525 → ₹510
📈 Upside Possibility?
Only if price reclaims ₹550+ and sustains above the 30M FVG zone, else sellers likely remain in control.
🧠 Strategy:
Consider short on retest of 1H FVG with SL above ₹550
Targeting downside levels as per risk-reward plan
📌 Disclaimer: This is a personal analysis, not financial advice. Do your own research before trading.

BEst buying opportunity for $NSE:CHAMBLFERTi) 200 dema touched.
ii) Resistance turned support.
iii) 0.744 fib retrace.
My perosonal analysis to buy NSE:CHAMBLFERT at/around 550 Levels.
**Personal Analysis**
SL : Just Below 510
Taking profit at ATH retest.
******************************

CHAMBLFERT - Chambal Fertilizers Ltd. (Daily chart, NSE) - LongCHAMBLFERT - Chambal Fertilizers Ltd. (Daily chart, NSE) - Long Position; short-term swing research idea.
Risk assessment: High {volume & support structure integrity risk}
Risk/Reward ratio ~ 3.41
Current Market Price (CMP) ~ 594
Entry limit ~ 592 on May 27, 2025
1. Target limit ~ 610 (+3.04%; +18 points)
2. Target limit ~ 625 (+5.57%; +33 points)
3. Target limit ~ 650 (+9.80%; +58 points)
Stop order limit ~ 575 (-2.87%; -17 points)
Disclaimer: Investments in securities markets are subject to market risks. All information presented in this group is strictly for reference and personal study purposes only and is not a recommendation and/or a solicitation to act upon under any interpretation of the letter.
LEGEND:
{curly brackets} = observation notes
= important updates
(parentheses) = information details
~ tilde/approximation = variable value
-hyphen = fixed value

ChamblFert , 1WLooking very good Pattern Breakout in Weekly Time Frame
Nifty is Also Looking Bullish , Very High Chances for going Up
Expanding Channel Pattern is Breaking Out . Enter After A Good Bullish Candle


CHAMBLEFERT IDEAChamblfert looks like at a good demand zone. Expecting good one time bounce from this area and one green candle after long rail of back to back red candles.

bullish set up sl 570 target 600chamalal fertilizerbullish chart pattern with consolidation.
accumulation zone 580, sl 550, target 600, followed by 610

Chambal fertilizerChambal fertilizer in bullish structure. Good at cmp fr targets marked with horizontal rays. Good positional if momentum continues.

Chambal Fertilizer Relatively stronger stock in market fall, holding 540-560 breakout zone zone and market strength will lead this for 700. Other sectoral strong stock is UPL since earnings day

CHAMBAL FERT Swing Trade LongEntry - 547.30/-
T1 - 37% (Time Frame - 1 to 3 months)
T2 - 96% (Time Frame - 4 to 6 months)
Only for education purposes

Chambal Fertilizers - Long*Chambal Fertilizers - CMP - 555 / Positional Trade*
*Buy Range 550 - 556 ONLY / Stop Loss 515 in weekly candle closing*
*Target 1 - 575*
*Target 2 - 600*
*Target 3 - 625 / 650*
Disclaimer: This is my view and for educational purpose only.

Key Support / Resistance Breakout - Swing TradeDisclaimer: I am not a Sebi registered adviser.
This Idea is publish purely for educational purpose only before investing in any stocks please take advise from your financial adviser.
Key Support & Resistance Breakout. Stock has give Breakout of Resistance level. Keep in watch list. Buy above the high. Suitable for Swing Trade. Stop loss & Target Shown on Chart.
Be Discipline because discipline is the Key to Success in the STOCK Market.
Trade What you see not what you Think.

CHAMBLFERTCHAMBLFERT, watch above levels. redline is our SL.
DISCLAIMER : I am NOT a SEBI registered advisor or a financial adviser. All the views are for educational purpose only.


BULLISH"LONG-TERM INVESTMENT IN CHAMBAL FERTILIZERS (6-9 MONTHS)📊 Long-Term Opportunity: NSE:CHAMBLFERT (6-9 Months)
🔍 Overview:
Chambal Fertilizers presents a 📈 bullish opportunity for long-term investors, supported by strong technical patterns and sectoral growth potential. With a favorable risk-reward ratio and government focus on 🌾 agriculture, this stock could deliver significant returns in the next 6-9 months.
🚀 Key Opportunity Highlights:
1️⃣ 📌 Entry Point:
A breakout above ₹510 (expected before 22/01/2025) signals the start of a major uptrend.
2️⃣ 🛑 Stop-Loss:
Maintain a stop-loss at ₹485 to protect your capital.
3️⃣ 🎯 Targets:
🟡TP1 (Short-Term): ₹551 – A critical resistance level with high likelihood of being reached.
🟡TP2 (Mid-Term): ₹610 – A strong intermediate target for potential gains.
🟡TP3 (Long-Term): ₹710 – Final target achievable within the 6-9 month timeframe
4️⃣ 📊 Technical Setup:
Head & Shoulders Pattern indicates strong bullish potential.
Support from trendlines and moving averages aligns with an upward trajectory.
5️⃣ 📅 Fundamental Catalyst:
Budget 2025 and government focus on agriculture create a 🌟 favorable backdrop for growth in this sector.
🌟 Why This Opportunity Stands Out
📐 Strong Technical Setup: Clear patterns support bullish momentum.
📅 Budget-Driven Growth: Agriculture-focused policies could act as a major growth driver.
⚖️ Balanced Strategy: Defined entry, stop-loss, and targets create a well-structured opportunity.
⚠️ Note: This is a high-potential opportunity but should be pursued with proper risk management. Always consult your financial advisor before making investment decisions.
🔴 Disclaimer
I am not SEBI-registered, and this analysis is shared for educational and informational purposes only. Stocks and securities are subject to market risks, and past performance is not indicative of future results.
Please read all levels, key highlights, and the associated risks carefully before making any investment decisions.ensure alignment with your investment goals and risk appetite.
If you really like this idea...leave a coment below...
Like,share,subscribe @Alpha_strike_trader

SWING IDEA - CHAMBAL FERTILIZERSChambal Fertilizers , a leading manufacturer of fertilizers and agri-products in India, is presenting a compelling swing trade setup with strong technical indicators.
Reasons are listed below :
Break of Cup and Handle Pattern : A classic bullish continuation pattern indicating potential for a significant upside.
Bullish Marubozu Candle : A strong bullish marubozu candle on the weekly timeframe highlights sustained buying pressure.
500 Zone Breakout : The price is attempting to break above the 500 resistance zone after consolidating near its all-time high, signaling strength.
Prolonged Consolidation Breakout : The stock is breaking out of a consolidation phase spanning over 3 years, suggesting a fresh trend initiation.
Target - 675
Stoploss - weekly close below 440
DISCLAIMER -
Decisions to buy, sell, hold or trade in securities, commodities and other investments involve risk and are best made based on the advice of qualified financial professionals. Any trading in securities or other investments involves a risk of substantial losses. The practice of "Day Trading" involves particularly high risks and can cause you to lose substantial sums of money. Before undertaking any trading program, you should consult a qualified financial professional. Please consider carefully whether such trading is suitable for you in light of your financial condition and ability to bear financial risks. Under no circumstances shall we be liable for any loss or damage you or anyone else incurs as a result of any trading or investment activity that you or anyone else engages in based on any information or material you receive through TradingView or our services.
@visionary.growth.insights

CHAMBAL FERTILISERS:C&S PATTERN NECKLINE BREAKOUTChambal : Has clearly given Cup&Saucer Neckline break out in daily chart.As per the pattern the Target would be 580+,Moreover 20DEMA Golden cross over above 50/100/200DEMAs further establishes the Price action and momentum of the stock.(For educational purpose only+

Monthly Analysis On CHAMBAL FERTILIZER As Stock Has given All Time High Breakout..And on A monthly Chart it Is Consolidating Since 3 Months ..Now A Really Toward 800 Level Is Expected..One Can Plan Trade According Analysis..Plz Discuss With Your Financial advisor before Taking Action...

CHAMBLFERTSupport and Resistance Levels: In technical analysis, support and resistance levels are significant price levels where buying or selling interest tends to be strong. They are identified based on previous price levels where the price has shown a tendency to reverse or find support.

Chambal FertliiserChambal Fertliser
MTF Analysis
Chambal FertliserYearly Demand Breakout 451
Chambal Fertliser 6 Month Demand 385
Chambal FertliserQtrly Demand BUFL 403
Chambal FertliserMonthly Demand 403
Chambal FertliserWeekly Demand 437
Chambal FertliserDaily Demand BUFL 488
ENTRY -1 488
SL 475
RISK 13
Potential Target 673
First Target Points 574
First recovery Target Points 99
Last Swing Low 475
Last Swing High 574
RR 8
RR 38%
