CHABMLFERT looks good.CHABMLFERT looks good for long term view.This is only for educational purpose.
CHAMBLFERT trade ideas

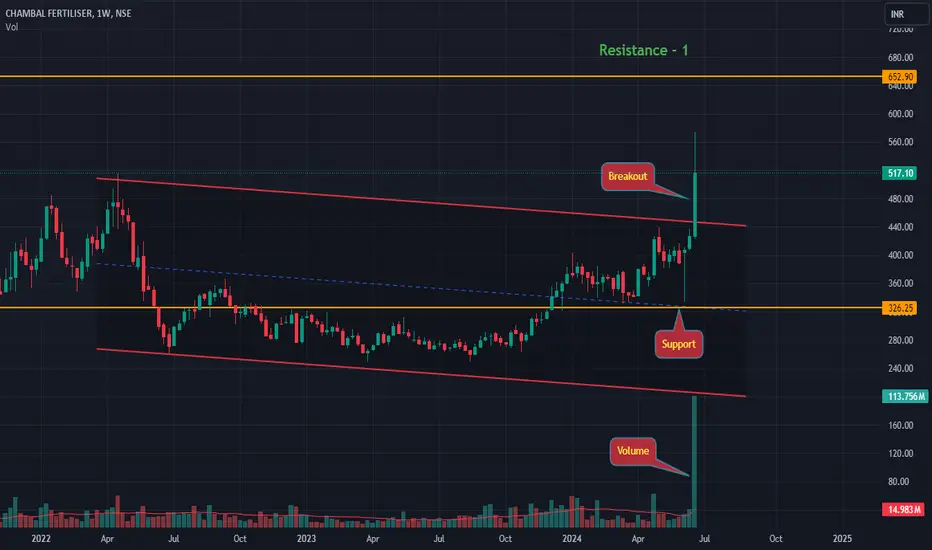
CHAMBAL FERTILIZERS LTD S/RSupport and Resistance Levels:
Support Levels: These are price points (green line/share) where a downward trend may be halted due to a concentration of buying interest. Imagine them as a safety net where buyers step in, preventing further decline.
Resistance Levels: Conversely, resistance levels (red line/shade) are where upward trends might stall due to increased selling interest. They act like a ceiling where sellers come in to push prices down.
Breakouts:
Bullish Breakout: When the price moves above resistance, it often indicates strong buying interest and the potential for a continued uptrend. Traders may view this as a signal to buy or hold.
Bearish Breakout: When the price falls below support, it can signal strong selling interest and the potential for a continued downtrend. Traders might see this as a cue to sell or avoid buying.
20 EMA (Exponential Moving Average):
Above 20 EMA: If the stock price is above the 20 EMA, it suggests a potential uptrend or bullish momentum.
Below 20 EMA: If the stock price is below the 20 EMA, it indicates a potential downtrend or bearish momentum.
Trendline: A trendline is a straight line drawn on a chart to represent the general direction of a data point set.
Uptrend Line: Drawn by connecting the lows in an upward trend. Indicates that the price is moving higher over time. Acts as a support level, where prices tend to bounce upward.
Downtrend Line: Drawn by connecting the highs in a downward trend. Indicates that the price is moving lower over time. It acts as a resistance level, where prices tend to drop.
RSI: RSI readings greater than the 70 level are overbought territory, and RSI readings lower than the 30 level are considered oversold territory.
Combining RSI with Support and Resistance:
Support Level: This is a price level where a stock tends to find buying interest, preventing it from falling further. If RSI is showing an oversold condition (below 30) and the price is near or at a strong support level, it could be a good buy signal.
Resistance Level: This is a price level where a stock tends to find selling interest, preventing it from rising further. If RSI is showing an overbought condition (above 70) and the price is near or at a strong resistance level, it could be a signal to sell or short the asset.
Disclaimer:
I am not a SEBI registered. The information provided here is for learning purposes only and should not be interpreted as financial advice. Consider the broader market context and consult with a qualified financial advisor before making investment decisions.

CHAMBALFERT potential breakout Potential trendline breakout opportunity.
Tight price action near trendline.
50days base after giving a big move of 72% in 19days.

chambalfert: after a breakout in conoslidation phaseChambal fertilizer: gave solid breakout on 20 june, after that it was in good consolidation and sideways move,
Now there is a strong resistance of around 540, once that is taken out nicely we may see a good rally towards 570-600.
disclaimer: we are not sebi registered, only for educational purposes.

Cup & Handle on weekly chartReady for a breakout with Cup & Handle pattern on a weekly chart. Observe a increase in volume. Closing above the recent consolidation should result in a good rally.

SWING IDEA - CHAMBAL FERTILISERChambal Fertilisers , a prominent player in the fertiliser industry, has recently garnered attention for its intriguing price action and technical indicators, prompting a closer examination for potential trading prospects.
Reasons are listed below :
Recent price action witnessed a breakthrough of the strong resistance zone at 350 levels, indicating a potential shift in market sentiment towards bullish momentum.
A bullish engulfing candle on the weekly timeframe signals a bullish reversal, suggesting a possible uptrend ahead.
The price aligns closely with the 0.382 Fibonacci retracement level, providing added support to the bullish outlook.
After over two years of consolidation, the stock has finally broken out of this range-bound behavior, indicating a change in trend dynamics.
Recording its highest close in eight weeks, Chambal Fertilisers trades above the 50 and 200 exponential moving averages (EMA), indicating strong bullish momentum.
Consistent higher highs in the price action suggest a sustained uptrend.
Notable upticks in trading volumes accompany recent price movements, indicating heightened investor interest and potential for significant price moves.
Target - 415 // 480 // 515
StopLoss - weekly close below 340
DISCLAIMER -
Decisions to buy, sell, hold or trade in securities, commodities and other investments involve risk and are best made based on the advice of qualified financial professionals. Any trading in securities or other investments involves a risk of substantial losses. The practice of "Day Trading" involves particularly high risks and can cause you to lose substantial sums of money. Before undertaking any trading program, you should consult a qualified financial professional. Please consider carefully whether such trading is suitable for you in light of your financial condition and ability to bear financial risks. Under no circumstances shall we be liable for any loss or damage you or anyone else incurs as a result of any trading or investment activity that you or anyone else engages in based on any information or material you receive through TradingView or our services.
@visionary.growth.insights

CHAMBAL Fertiliser A good buying can see from 490’s level.
Better to wait for sometime and then make a good LONG trade .
Levels->
Buying area: 488-495
TP: 530, 535, 550+
SL: 478

nuturalavoid green lines as they are intraday lines only observe yellow lines, price is moving in a channel the lower downward shifting line occured due to shiftb in frequency shift followed by similar effect the third line from below is created.
further look at yellow frequency line those supporting frequency line which got voilated but still buyers are maintaining ground by not closing candles below it that a good sign but still its moving in a channel its direction is not decided yet........for further update follow.....

CHAMBAL Fertiliser analysisCHAMBAL Fertiliser on a daily time frame
CUP chart pattern
Monthly and Weekly RSI above 60 levels
Daily, 75 mins and 15 mins RSI declining
It should retrace the neckline levels to retest the levels.
If you calculate the retracement, it should retrace between 23.6 to 38.2%.
You can notice unusual volume on a break-out candle.

CHAMBLFERT - BULLISH SetupStock name - Chambal Fert. & Chems. Limited.
Weekly chart setup
Chart is self explanatory. Levels of breakout, possible up-moves (where stock may find resistances) and support (close below which, setup will be invalidated) are clearly defined.
Master Score - B
Disclaimer: This is for demonstration and educational purpose only. this is not buying and selling recommendations. I am not SEBI registered. please consult your financial advisor before taking any trade.
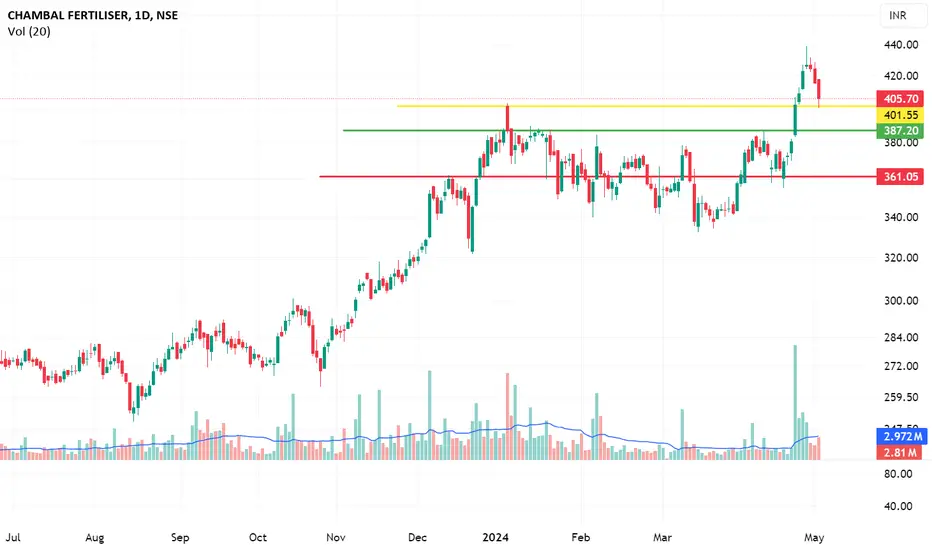
BuyThe stock gave a good breakout on daily chart with good volumes. 418 would be a good entry point with target upto 440.

Chambal Fertiliser at trendline supportVery good risk-reward ratio......Forming a dojo today. Great move is expected.

Chambal Fertilisers & Chemicals Ltd breakout with volumeChambal Fertilisers & Chemicals Ltd is engaged in production of Urea from its own manufacturing plants. It also markets/ deals in other fertilisers and agri-inputs. It also has a Joint Venture for manufacture of Phospohric Acid in Morocco.
The company was also engaged in Software business, However, in FY21, it sold assets and transferred certain liabilities of the business to cease the operations of the software business.
This looks have great volume and breakout.
Good for short and mid term.
Looking bullish.

Sell Setup Last Close : 347 , Sell On Rise Till 398 For The target 338 , If Breaks 338 with volume and get 2 consecutive close below and a weekly close below it than will slide till 281

chambal fertilizer : 25% Target SWING TRADING Recently it broken the big resistance of 385 and given big UPMOVE UPTO the level of 439. It witnessed profit booking there and retest the same resistance of 385. After taking support of 385 nowxit is ready for target of 500+.
Time frame 3months.
Stoploss : 385

CHAMBLFERTNSE:CHAMBLFERT
Chemical Sector stock
Retest after Breakout
Support @387
Can add till 361 and maintain as SL on closing Basis.
Rsi>50
MA showing Buy
only for educational Purpose
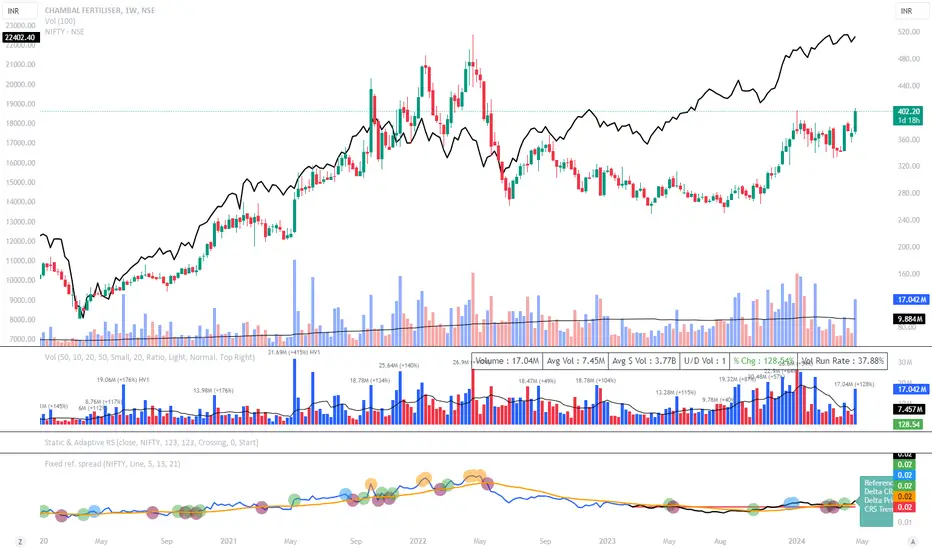
Unfolding Waves in Chambal Fertilisers: Bullish Path AheadAn analysis of Chambal Fertilizers using Elliott Waves, we can observe an interesting progression in the stock's price movements on a weekly cycle. The chart has completed the initial waves I through IV, and it is currently unfolding wave V, signaling a strong potential for a bullish trend ahead. Let's delve deeper into the details of this wave analysis.
Weekly Cycle
Wave V: We are observing the unfolding of wave V on the weekly cycle. This wave is showing potential for further upside as the stock completes its final wave in the longer timeframe.
Subdivision of Wave V: Within wave V, the stock has already completed waves (1) and (2), and it is now unfolding wave (3).
Wave (3) of Wave V
Progression within Wave (3): In the ongoing wave (3) of V, we've seen waves 1 through 4 completed, and the current focus is on wave 5 of (3).
Hourly Timeframe
Progression within Wave 5 of (3) of V: In this specific timeframe, wave 5 has already seen the completion of sub-waves ((i)), ((ii)), ((iii)), and nearly all of wave ((iv)). This suggests we are likely at the end of wave ((iv)), poised for wave ((v)).
Elliott Waves Fundamentals
Wave Counts: The stock's progression through each wave provides valuable insights into potential market behavior. The typical characteristics of an impulsive wave, as seen in the unfolding of wave V, include strong, directional movements, which are followed by corrective waves.
It’s essential to apply appropriate risk management techniques, such as setting stop losses, to mitigate potential downsides. Be cautious in managing your exposure and avoid over-leveraging.
This analysis is purely for educational purposes and should not be taken as investment advice. Always conduct your own research and consult a financial professional before making any investment decisions. Remember, market conditions can change rapidly, and past performance does not guarantee future results.
This analysis aims to provide an overview of the potential trajectory of Chambal Fertilisers based on Elliott Waves. It's always important to stay vigilant and adjust your approach as new information becomes available. Happy trading!
I am not Sebi registered analyst.
My studies are for educational purpose only.
Please Consult your financial advisor before trading or investing.
I am not responsible for any kinds of your profits and your losses.
Most investors treat trading as a hobby because they have a full-time job doing something else.
However, If you treat trading like a business, it will pay you like a business.
If you treat like a hobby, hobbies don't pay, they cost you...!
Hope this post is helpful to community
Thanks
RK💕
Disclaimer and Risk Warning.
The analysis and discussion provided on in.tradingview.com is intended for educational purposes only and should not be relied upon for trading decisions. RK_Charts is not an investment adviser and the information provided here should not be taken as professional investment advice. Before buying or selling any investments, securities, or precious metals, it is recommended that you conduct your own due diligence. RK_Charts does not share in your profits and will not take responsibility for any losses you may incur. So Please Consult your financial advisor before trading or investing.


Investment Opportunity Alert! Chambal Fertilizers & Chemicals🚀🌱 Investment Opportunity Alert! Chambal Fertilizers & Chemicals Limited 🌱🚀
📈 Stock Symbol: CHMBL
📉 Stop Loss: Below 349
🎯 Targets: 476 and 506
⏳ Investment Horizon: 2 Years
Looking for a promising investment opportunity in the fertilizer sector? Look no further than Chambal Fertilizers & Chemicals Limited! With a strategic stop loss below 349, and ambitious targets set at 476 and 506, this stock presents an exciting opportunity for long-term investors.
Why Chambal Fertilizers?
🌿 Robust Industry Fundamentals: With agriculture being a crucial sector, fertilizer demand remains resilient, ensuring a stable revenue stream for Chambal Fertilizers.
📊 Strong Financials: Chambal Fertilizers boasts strong financial performance, making it an attractive choice for investors seeking stability and growth.
💼 Experienced Management: Backed by a competent management team, Chambal Fertilizers is well-positioned to navigate market challenges and capitalize on growth opportunities.
📅 Investment Horizon: While short-term fluctuations are inevitable, a 2-year investment horizon provides ample time for the stock to realize its full potential, offering investors substantial returns.
Don't miss out on this opportunity to capitalize on the growth potential of Chambal Fertilizers & Chemicals Limited. Invest today and watch your portfolio flourish over the coming years! 🌱💼 #Investing #Stocks #ChambalFertilizers #LongTermInvestment

#CHAMBLFERT 372 TGT 430 #FACT #RCF #NFL #GSFC #PARADEEP #GNFCCHAMBLFERT 372
TGT 430
SL 350
Risk <7%
Return >15%
RR >2
Timeframe <6M
NSE:CHAMBLFERT
Buy Recommended
Can hold for long term
Shared with 💚
By Rachit Sethia

CHAMBLFERT giving BOFertilizer stock showed delivery based buying. CHAMBLFERT looks like leader in the group
SWING BREAKOUT STOCKNSE:CHAMBLFERT
All information on this page is for educational purposes only,
we are not SEBI Registered, Please consult a SEBI registered financial advisor for your financial matters before investing And taking any decision. We are not responsible for any profit/loss you made.

Buy CHAMBLFERT AROUND 280-290 TARGET315/360/470/620 SL BELOW 205It was in deep consolidation around 200 Weekly EMA . It is picking up good volumes around that level, if breakout one then above mentioned targets can be achieved easily
