HOW TO TRADE 'BIG CANDLE"This is an educational video showing a trade set up based on big candles.
This video is for information/education purpose only. you are 100% responsible for any actions you take by reading/viewing this post.
please consult your financial advisor before taking any action.
----Vinaykumar hiremath, CMT
CIPLA trade ideas

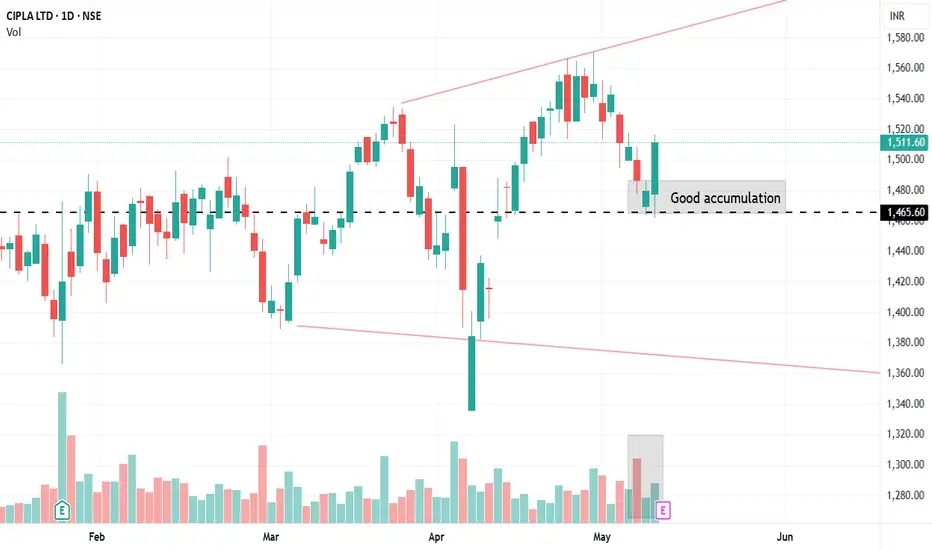
Cipla good breakout with volume supportCipla 1511 has given a good breakout with volume support. with 1465 as support we expect nit could move to 1600.
On valuation it is trading at 24 P/E of its FY26 EPS of an average of 27 P/E which is 1671 that made us to believe it is available at discount.
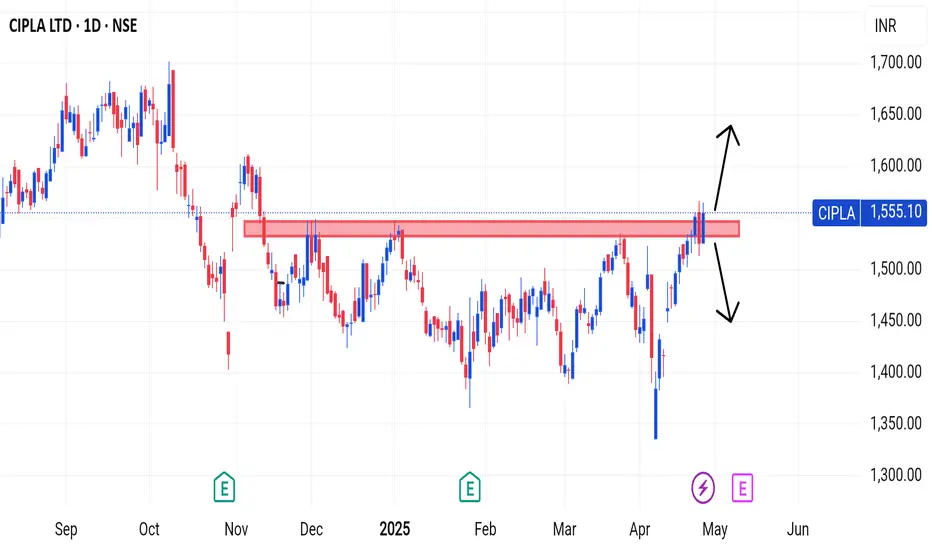
CIPLAA very good breakout has been given above the resistance level. Now uptrends can be expected. Sales are expected to continue if it falls below the resistance level
If you find this helpful and want more FREE forecasts in TradingView, Hit the 'BOOST' button
Drop some feedback in the comments below! (e.g., What did you find most useful?
How can we improve?)
Your support is appreciated!
Now, it's your turn!
Be sure to leave a comment; let us know how you see this opportunity and forecast.
Have a successful week
DISCLAIMER: I am NOT a SEBI registered advisor or a financial adviser. All the views are for educational purpose only
Go long in CIPLAIt's a very good breakout in Cipla on intraday basis. From here, we can expect targets of 1610 & 1680. Hold for 1-2 weeks.
Stoploss against this investment can be placed near 1510.

CIPLA CHANNEL BREAKOUT AND FORMING CUP HANDLECipla broke long term Channel and doing retest on Daily TF
Cup and handle forming on 1 hr TF
Buy on dips till 1440-1445
Idea Invalid if closing below 1434 on Daily TF

CIPLA Stock is facing resistance in daily time frame#CIPLA
Stock is facing resistance in daily time frame .Can expect good upmove once it breaks and sustains above the resistance.Keep on Radar.
Disclaimer:-All views are my personal and only for educational purpose.
#StockMarketIndia
#LetsLearnTogether

CIPLA has possibility to move towards 850?CIPLA has moved below all moving average and also it has crossed lakshman rekha.
It has possibility to move towards below level,
1313 - 1150 - 1015 - 850 - 750

Cipla fresh swing buyingWe can see more divergence in volume and more money flux in cipla. Trade with care.

CIPLA ......Sharp fall May Expected in Few DaysCipla has broken the Decending Triangle Structure .....Reteted the Broken Line today.....There are Several Gaps (Unfilled Order Blocks) in down side .....Hopefully we gonna see a sharp fall soon.....Below Red lines are GAPS to be filled up ...

CIPLA - BUY - 1755CIPLA to hit the lower levels of 1268 before flying to the higher levels of 1755.
The Stock has shown consolidation for the last 2 months .

cipla break down | short view Charts for Educational purposes only.
Please follow strict stop loss and risk reward if you follow the level.
Thanks,

GO LONG ON CIPLAGo Long On Cipla. The Stock has touched the high of 1700. Now it stands corrected at Levels of 1475 i.e. 13% correction. Short Time Frames stand oversold. One can buy Cipla @ current Levels of 1475.00. Three Targets 1550, 1600 & 1700. One can buy accordingly with a strict Stop loss of 1403.00.

Cipla (Cash) stock Intraday outlook on December 04, 2024The Cipla stock is likely to be bearish on Dec 04, 2024. By not taking the gaps on the either side into account, I foresee a bearish trend during intraday. There is an Intraday Resistance level at 1553 and Intraday Support at 1504. Observe this stock tomorrow. Technical confirmation is a must.
Never trade without Stop-Loss.

CiplaLtd view for Intraday 3rd Dec #CIPLA CiplaLtd view for Intraday 3rd Dec #CIPLA
Resistance 1520. Watching above 1525 for upside movement...
Support area 1500 Below 1500 ignoring upside momentum for intraday
Support 1500 Watching below 1497 for downside movement...
Resistance area 1520
Above 1520 ignoring downside move for intraday
Charts for Educational purposes only.
Please follow strict stop loss and risk reward if you follow the level.
Thanks,
V Trade Point

Cipla ready to breakoutThe price action suggest, it might break out above at least 1300.
Still chances to move until 1320. Targets calculated with fib.
Within this month we could see Cipla crossing 1300.

Analysis of Cipla Ltd. (NSE: CIPLA)Technical Analysis of Cipla Ltd. (NSE: CIPLA) - 30-Minute Timeframe
Based on the provided chart, here are the key technical observations:
Rising Wedge Pattern:
Cipla is showing a rising wedge pattern on the 30-minute chart. This pattern is typically a bearish sign when it forms after an uptrend, as it indicates that buying momentum may be weakening.
A breakdown from this rising wedge could signal a potential reversal, with targets at lower levels.
Fibonacci Retracement Levels:
Fibonacci retracement levels have been drawn on the chart, indicating potential support levels if the price begins to correct:
23.6% Level at ₹1,555.75 – Initial support if the price begins to retrace.
38.2% Level at ₹1,526.55 – A stronger support level.
50% Level at ₹1,503 – This midpoint level could serve as a significant support.
The current price is hovering near ₹1,604.85, so if the rising wedge pattern breaks down, these Fibonacci levels will be key areas to monitor for support.
Target Level:
If Cipla breaks below the rising wedge, it could head towards the target zone near ₹1,525 (38.2% Fibonacci level) or even ₹1,500 if the selling pressure continues.
Volume Analysis:
The volume spike on the initial upward move shows strong buying interest, but a reduction in volume as the price approaches resistance within the wedge pattern suggests weakening bullish momentum.
Fundamental Analysis of Cipla Ltd.
Company Overview:
Cipla is one of India's leading pharmaceutical companies, with a strong presence in the respiratory, cardiovascular, anti-retroviral, and other therapeutic segments. It is also expanding its footprint in the U.S. market.
Revenue and Profit Growth:
Cipla has shown consistent revenue growth driven by its domestic business and increasing exports. The company’s presence in the U.S. and other export markets adds diversification and growth opportunities.
Cipla’s emphasis on high-growth therapeutic areas like respiratory and chronic diseases aligns with long-term global healthcare trends.
Investment in R&D:
Cipla’s focus on research and development (R&D) for specialty and generic drugs has helped the company maintain a competitive edge. This R&D investment positions Cipla well for future growth in specialty drugs, which have higher margins.
Balance Sheet and Cash Flow:
The company has a stable balance sheet with moderate debt levels. Cipla also has strong free cash flow generation, which supports its R&D initiatives and expansion efforts.
Sector Outlook:
The pharmaceutical sector has a positive outlook due to increasing healthcare needs, particularly post-pandemic, and Cipla is well-positioned to benefit from rising demand for both chronic and specialty drugs.
Conclusion:
Technical Outlook: Cipla is currently trading within a rising wedge pattern, which is typically bearish. A breakdown below this wedge could push the price towards support levels at ₹1,555, ₹1,526, and potentially ₹1,500.
Fundamental Outlook: Cipla has strong fundamentals, driven by its diverse product portfolio, international growth, and focus on R&D. The pharmaceutical sector's positive outlook provides a supportive environment for Cipla's long-term growth.

Cipla Ltd for Intraday 31st October #CIPLA Cipla Ltd for Intraday 31st October #CIPLA
Resistance 1430. Watching above 1433 for upside movement...
Support area 1400. Below 1400 ignoring upside momentum for intraday
Support 1400 .Watching below 1397 for downside movement...
Resistance area 1430
Above 1430 ignoring downside move for intraday
Charts for Educational purposes only.
Please follow strict stop loss and risk reward if you follow the level.
Thanks,
V Trade Point

Review and plan for 30th October2024Nifty future and banknifty future analysis and intraday plan in kannada.
Results!
This video is for information/education purpose only. you are 100% responsible for any actions you take by reading/viewing this post.
please consult your financial advisor before taking any action.
----Vinaykumar hiremath, CMT


CIPLA - Beautiful range breakout at all time high.Cipla is in range and is all geared up to break and reach all time high.
The target and stoploss are marked in chart

cipla buy for swing
first buy near 1595
with 2.50%sl
second buy with 2.50%sl buy near 1530
tgt2% 4%6%8%10%

CiplaCipla taking support on trend line, Positive Structure stronger than Index. RSI showing strength.

Cipla Ltd intraday level for 7th Aug #CIPLA Cipla Ltd intraday level for 7th Aug #CIPLA
Buying may witness above 1542
Support area 1520. Below ignoring buying momentum for intraday
Charts for Educational purposes only.
Please follow strict stop loss and risk reward if you follow the level.
Thanks,
V Trade Point
