CIPLA trade ideas

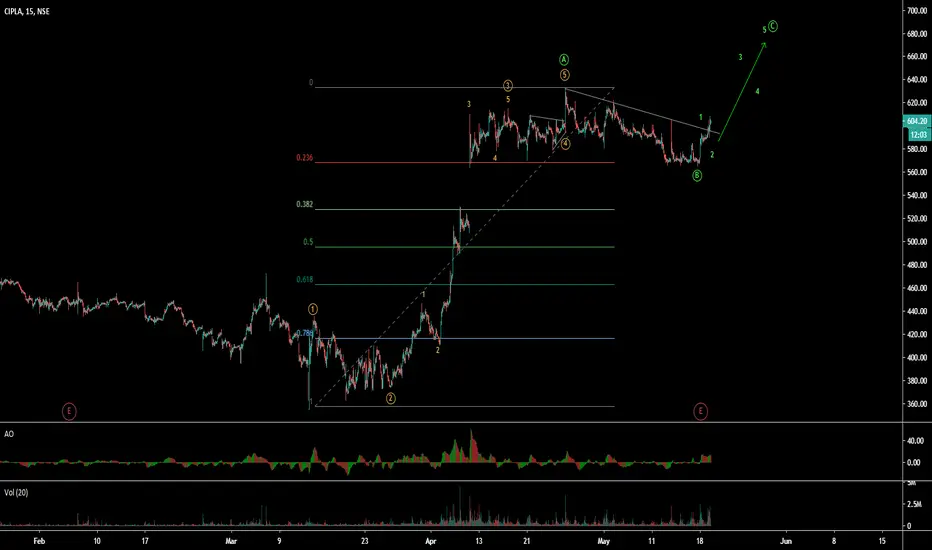
Cipla Ltd (CIPLA - India) - ABC zigzag patternCipla Ltd (CIPLA - India) is in ABC from major bottom as shown chart. After strong A wave, price just giving B wave flat within upper 24% area. Now wave C is started with relative high volume & also break the resistant trend line, which go for next new high with high possibility, until invalidation area should not be breached.
Cipla Analysis for the Month of April to May 2020.Sell activated 27th April20 , it will retrace now to the lvl which is mention above.
if you get at that Range which i mention above plz get into the sell side.


Cipla Shiftting closer to Target : 500=>time to sell.
I LIKE, then you will get a notification on Cipla .
I update on telegram


INTRADAY buy @ 585 SL 580 tgt 597/615/623 sell below 567 tgt558INTRADAY buy @ 585 SL 580 tgt 597/615/623 sell below 567 tgt562/558 sl 569

CIPLA DOWNWARD BREAKOUT LIKELYCIPLA if breaks below 588 can be a good sell, if the breakout is with above average volumes. Simple Chart formation, simple visual analysis

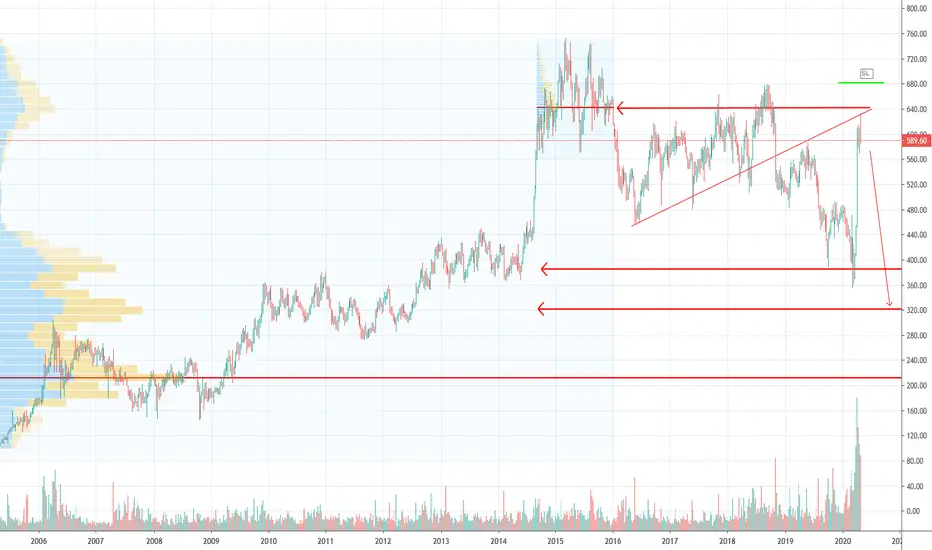
CIPLA - Probable Downfall in coming session(s) - POSITIONALCipla seems to have a bearish sentiment. Broken the Channel and the Monthly zones with good volume. Expecting it to fall further (a retracement to the red line is quite possible). Will be entering short basis candlestick pattern and if it shows rejection below the red line for a TGT of about 521-525.
Entry would be mostly around 585 (near to the red line, if retracement is seen), SL above 603.5, TGT: 521-525.
Disclaimer: These are just my views, I am only SHARING my views - kindly do NOT trade blindly with these levels, please do your own research before entering/ or as per advice from your own financial adviser.
Note: All the values given are in CIPLA spot price chart. And also please note this is Positional analysis and is NOT for intraday
This can be followed by a long entry later on after completion of a Harmonic Pattern, will be updated later if a good entry is seen

Cipla expecting further downsideCipla appears weak and there might be furhter downside after a pull back

#CIPLA @Cipla_Global #CNXPHARMAShortTerm Target Rs. 462
LongTerm Target Rs. 485
StopLoss Rs. 437.5
CMP Rs. 447.10
SUPPORT & RESISTANCE


Cipla ~ Pullback over on this counter?I have been bearish on pharma since mid of April, (you can see my AURO Pharma analysis posted sometime back). Now here cipla looking for juicy short,as long as 680 not broken decisively.
Target 1 -322.
cipla rangecipla is currently in accumulation zone and also cipla momentum go down as per my analysis if cipla break 670 or below 670rs if cipla close so cipla weak... keep in radar...
cipla fill gape in future 429-470 gape


Bearish | Cipla |Daily time frameHey, I have developed a mathematical tool to find top and resistance. The give 5-6 signals in a year in one security (Daily time frame).
Have a look by clicking the link below-
youtu.be

LOOKING FOR SHORTITS IN COMPLETE DOWN CHANNEL AS PER THE DRAWN LINE.
PRICE MIGHT B COMING TOWRDS UPPER TRENDLINE ,LETS SEE HOW IT WORKS,EITHER BREAKUP OR AGAIN BOOM DOWNSIDE.


CIPLABefore the technical analysis, Please do like comment and follow.
In the Hourly time frame, there is a half-circle pattern formed. Take entry after the breakout is done, Easy target will reach when the breakout is done, but target will reach after the retest. Do wait for the target. A breakaway gap is there, as well as target, is also in the gap so it will fill the gap and it reaches the target

will cipla going to make new high ?as far trend is +ve / volume is good corrective move was expected after ,its now ready to again track

