#CNXFINANCE - 900 POINTS MOVE EXPECTEDDate: 28-07-2025
NiftyFinance Current Price: 26615.1
Pivot Point: 26709 Support: 26429 Resistance: 26991
Upside Targets:
Target 1: 27144
Target 2: 27298
Target 3: 27519
Downside Targets:
Target 1: 26274
Related indices

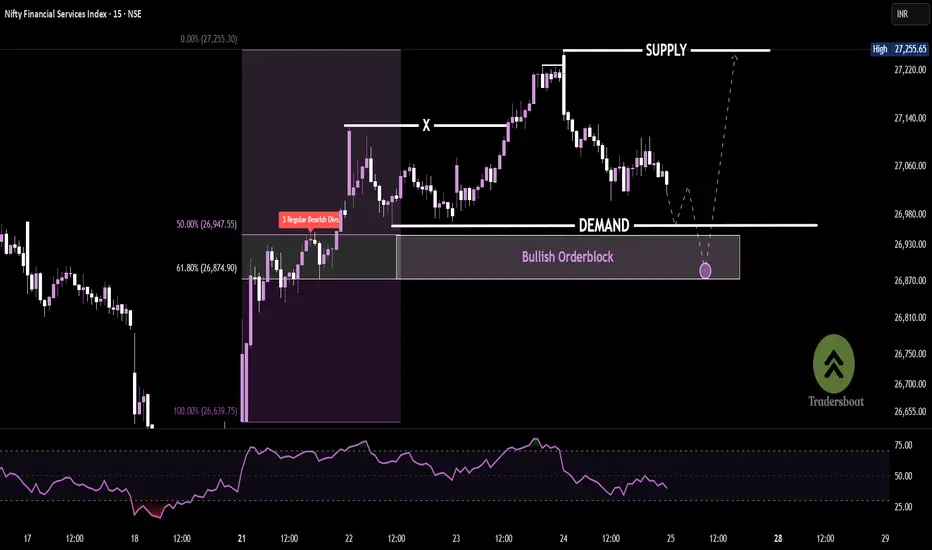
FINNIFTY -15MINPrice rallied from demand, showing strong momentum until bearish divergence triggered a short-term reversal from the supply zone.
Now price approaches a bullish order block, aligning with the 61.8% Fibonacci retracement, offering high-probability long entries.
A bullish reaction here could fuel a re
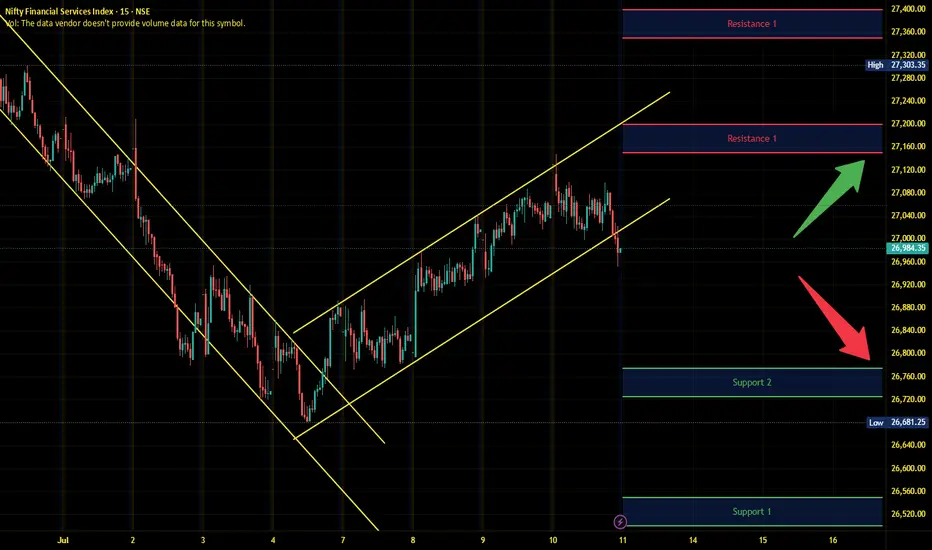
Finnifty Intraday Analysis for 11th July 2025NSE:CNXFINANCE
Index has resistance near 27150 - 27200 range and if index crosses and sustains above this level then may reach near 27350 - 27400 range.
Finnifty has immediate support near 26775 – 26725 range and if this support is broken then index may tank near 266550 – 26500 range.
#CNXFINANCE | 1900 points move on RadarDate: 13-05-2025
Current Price: 26206
Mid-Point: 26110.05
Upside Targets: 26976.63, 27390.85, 27871.15 and 28351.45
Downside Targets: 25245.07. 24829.25, 24348.95 and 23868.65
Resistance: 26562.40125
Support: 25660.90075
#CNXFINANCE

123//@version=5
strategy("Intraday Buy/Sell with Target & SL", overlay=true, default_qty_type=strategy.percent_of_equity, default_qty_value=100)
// INPUTS
rsiLength = input(14, "RSI Length")
rsiOverbought = input(70, "Overbought")
rsiOversold = input(30, "Oversold")
maLength = input(20, "Moving Averag

NIFTY FIN SERVICE FOR 21 APR#Execution only after break and close above or below from resistance or support 15-minute candle.
#Stop Loss above or below from resistance or support 15-minute candle.
(S/R Levels Will be Flipped in The Situation of Gap up OR Gap down Open, Support Will Turn in Resistance and Resistance Will Turn

FINNIFTY S/R for 7/4/25Support and Resistance Levels:
Support Levels: These are price points (green line/shade) where a downward trend may be halted due to a concentration of buying interest. Imagine them as a safety net where buyers step in, preventing further decline.
Resistance Levels: Conversely, resistance levels (re

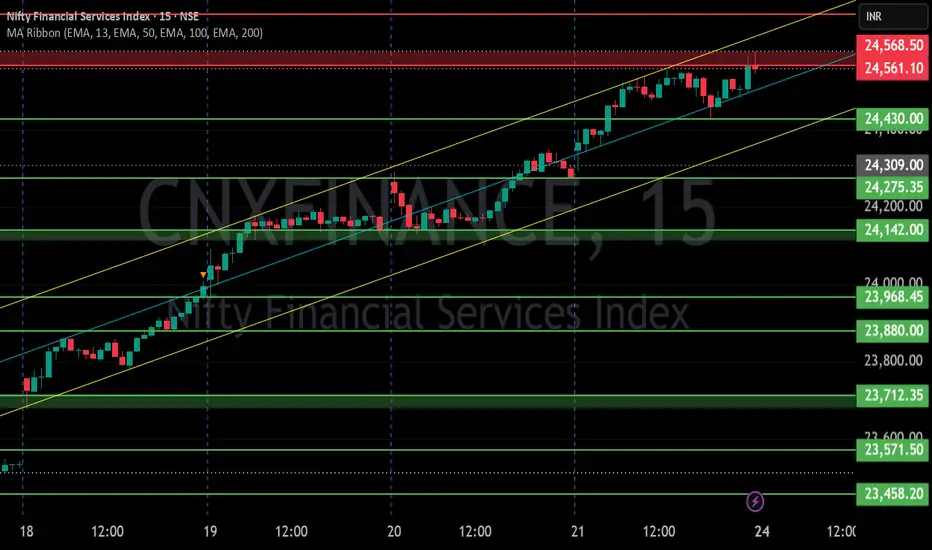
Index to watch out - Nifty Fin ServicesStrong weekly structure. Consistently trending for last many months and retracing quickly after downfall. Leading the overall pack across different indexes. It has a good combination of stocks. One can find good value pick from those stocks.
Note: Not a buy/sell recommendation. Sharing this for stu

FIN NIFTY S/R for 24/2/25Support and Resistance Levels:
Support Levels: These are price points (green line/shade) where a downward trend may be halted due to a concentration of buying interest. Imagine them as a safety net where buyers step in, preventing further decline.
Resistance Levels: Conversely, resistance levels (re
FIN NIFTY S/R for 19/2/25Support and Resistance Levels:
Support Levels: These are price points (green line/shade) where a downward trend may be halted due to a concentration of buying interest. Imagine them as a safety net where buyers step in, preventing further decline.
Resistance Levels: Conversely, resistance levels (re

See all ideas
Summarizing what the indicators are suggesting.
Oscillators
Neutral
SellBuy
Strong sellStrong buy
Strong sellSellNeutralBuyStrong buy
Oscillators
Neutral
SellBuy
Strong sellStrong buy
Strong sellSellNeutralBuyStrong buy
Summary
Neutral
SellBuy
Strong sellStrong buy
Strong sellSellNeutralBuyStrong buy
Summary
Neutral
SellBuy
Strong sellStrong buy
Strong sellSellNeutralBuyStrong buy
Summary
Neutral
SellBuy
Strong sellStrong buy
Strong sellSellNeutralBuyStrong buy
Moving Averages
Neutral
SellBuy
Strong sellStrong buy
Strong sellSellNeutralBuyStrong buy
Moving Averages
Neutral
SellBuy
Strong sellStrong buy
Strong sellSellNeutralBuyStrong buy
Displays a symbol's price movements over previous years to identify recurring trends.