Inverted H&S PatternThis is a standard H&S pattern. volume is yet to confirm in my view.
if R1 and R2 zone made a breakout than we expect for bullish run as chart pattern suggests.
CNXIT trade ideas

IT index is still under long term correctionnifty it index is under long term correction with c wave ongoing

Index OverviewIt shows all Index Overview. You can add how many indexes you want and see the overview nicely.

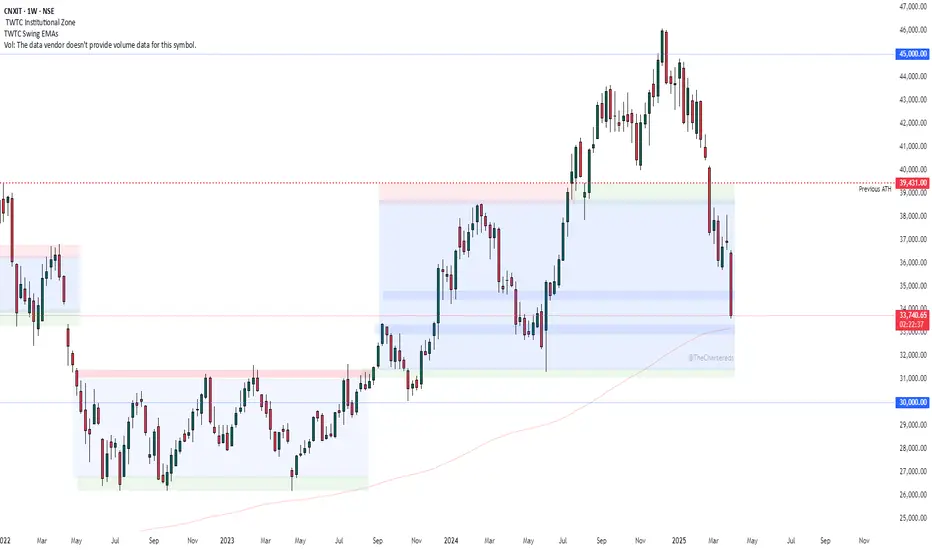
NIFTY IT - The Trump Effect :XThe chart is self-explanatory as always.
Trump's tariffs have sparked serious recession fears in the U.S., negatively impacting both the U.S. economy and its trading partners. Nifty IT is simply following the lead of IG:NASDAQ , which saw a sharp decline of over 5% yesterday.
From a technical standpoint, the price is currently at a crucial level near the 200 WEMA. The key support zone, in my opinion, lies between 31,450 and 31,400, with 30,000 serving as a significant psychological bounce point.
Now will it respect these levels or just bleed on panic? Time will tell.
What is your take on this sector?
Disclaimer: This analysis is purely for educational purposes and does not constitute trading advice. I am not a SEBI-registered advisor, and trading involves significant risk. Please consult with a financial advisor before making any investment decisions.
NIFTY IT: Is the Bounce Back on the Horizon?📈 NIFTY IT: Is the Bounce Back on the Horizon? 🚀
Current Market Price (CMP): 37,434
Stop Loss (SL): 35,700
Target 1: 38,733
Target 2: 40,527
📊 Market Overview:
After a ~23% correction from its peak, the NIFTY IT index is showing signs of stabilization. The index has formed a small base on the daily chart and today breached a minor resistance, suggesting potential for a short-term upside.
💡 Key Insight:
With April’s quarterly results on the horizon, the IT sector may experience increased trading activity, presenting short-term opportunities.
⚠️ Caution:
The market remains volatile—smart position sizing and strict risk management are crucial for navigating current conditions.
📌 Disclaimer: Not a SEBI-registered advisor. Always conduct your own research before making any investment decisions.
#NIFTYIT #StockMarket #TechnicalAnalysis #TradingOpportunity #MarketUpdate #InvestSmart

CNXIT, NIFTYThe Chart is bad in shape it can be clearly seen if it break long term trend lines . Those looking to short can Short after weekly closing below the trend lines .
Rest stay way from this index for time being . Long terms target clearly shown .... using two Fibonacci Extensions
This can also drag down NIFTY index with it by virtue of having 2nd Largest weight

Infosys Vs Nifty IT The markings on the chart are based on the Elliott Wave theory.
The IT index has lagged in strength over the last 1+ year and now seem to enter the next wave C down. While the index made a new high, the internal moves are corrective and divergent on the RSI which makes it a better wave (B) candidate.
The next few weeks should be a sharp fall in the IT stocks as wave (c) tend to be quick and less time taking.

NIFTY IT - After Effects of NASDAQ?📉The NASDAQ witnessed a sharp decline of approximately 4% yesterday, extending its overall downturn to nearly 13.5% in just three weeks, indicating a strong bearish sentiment.
📉On the other hand, Nifty IT has so far been holding above the 100-week exponential moving average (WEMA), which has been acting as a crucial support level.
📉However, given the significant slide in NASDAQ, there is a possibility that this support could be breached, which might accelerate further weakness in the IT sector.
📉If the breakdown occurs, two minor support zones could come into play and potentially act as temporary demand areas.
📊 Key Question: What Lies Ahead?
💡Will the IT sector continue its downward trajectory, or is this merely a short-term correction within a larger trend?
💡Keeping a close watch on price action to gauge whether the sector can stabilize or if further downside is imminent.
What’s your take on this? Drop your thoughts in the comments!
Disclaimer: This analysis is purely for educational purposes and does not constitute trading advice. I am not a SEBI-registered advisor, and trading involves significant risk. Please consult with a financial advisor before making any investment decisions.

#CNXIT #CNXIT
Whenever market becomes expensive, they tend to move away from #gravity line. During 2021/22 top when IT was leading, index was very far away from gravity line and during Q2 & Q3 - there was heavy distribution followed by the jerk in Q4 results with breakaway gap, which made the stocks & index to go into major consolidation period of almost 1.5 years between 2022 to 2023.
If history has to repeat, the rally in IT index which started from 32K levels since 45K-46K levels can be atleast used to lock partial gains and wait for any further bigger panic. What if, this structure again gets converted into H&S pattern, just like it did in 2022

CNXT IT - MAY CORRECT 10-12% CNXIT- I am expecting 10-12% correction in IT Index. We may see retest of BO level 39450 (also there is good DEMAND ZONE) which will be good for long entry in good IT stocks. As of now, I am tracking BSOFT & MPHASIS for long entry at mentioned level.

Indian IT Industry GPSIndian IT is currently doing Wave 2 in the form of running correction in pattern 3-3-5. In which it is in last leg of completion of this Wave 2 correction. Post correction it may see a very sharp rise in the form of Primary Wave 3.

IT IndexDue to AI , i personaly feels that IT index will fall and same time Tump trafic issues will effect IT index in India // Its only for knowledge sharing

Nifty IT ViewsThe Nifty IT index was side-ways for whole Sep to Oct 24, except during last 3 trading sessions, it has managed to place it self in the different trading range as shown in the chart drawing.
So, I though it will be worth revealing this chart.

Nifty It fresh break Niftyit given fresh flag out
Looking for strong upside
#cnxit #hcltech #wipro #tcs #infosys

Banknifty October 1st Week Analysis Banknifty looks Indecisive this week.We can expect small retracement in the upcoming week upto levels of 52800. But if it crosses 54300 on the upside then bearish view will negated and we can expect good momentum upto 55000+. Overall any retracement will be a buying opportunity.

IT sector analysisIT sector is at critical levels made strong bottom and following trendline as well and we can see MACD crossover too and RSI is above 40 means bullish if it sustains we can see nifty at 26500
can go long on good IT stocks as well like
TCS
INFOSYS
PERSISTENT
BSOFT
WIPRO

NIFTY IT LONGNifty IT
MTF Analysis
Nifty IT Yearly Demand Breakout 36132
Nifty IT 6 Month Demand DMIP 31587
Nifty IT 6 Month Demand BUFL WIP 38559
Nifty IT Qtrly Demand BUFL WIP 38559
Nifty IT Monthly Demand Breakout 38559
Nifty IT Weekly Demand BUFL 41834
Nifty IT Daily Demand BUFL 41936
ENTRY -1 41936
ENTRY -2 41834
Entry Avg 41885
SL 41591
RISK 345
Potential Target 49461
First recovery 5816
Last Swing Low 37829
Last Swing High 43645
RR 16.86
RR 18%

Nifty IT Complex Cup with HandleNifty IT had broken above the neckline of Complex Cup with Handle Pattern as can be seen in the chart.
It is down with some bad news in the Global Markets and currently, offers a sure shot returns of 21% as per the technical target.
This is the easiest money available in the Indian market right now as the companies included in the index are some of the largest and most trusted with excellent track record.
As they say, investors must 'Feel Greedy when others are Fearful.'
The worst is over for IT and this SAFE CONTRARIAN bet will surely make you feel proud of yourself when it achieves target.
You can trade this index with ITBEES ETF available on NSE.

Chart of the week. CNX ITIT index made all time high in Jan 22 @ 39000. After more than two and half year's consolidation it has successfully given a confirmed cup and handle breakout this week. I am recommending to long this index since long time. Henceforth Nifty IT will lead the market from front foot. One can buy IT bee's or can also make IT basket and make positions in big IT companies for good returns.
CMP - 40,800 (17/8/24)
T - 47500, 60700, 73800

IT Sector: 30% rally possible?Looks like IT sector will move another 30% this year, let see what happens

IT sector may fly soon ??Like always, the charts are self-explanatory :)
If you like such snippets, Do give us a like and a follow :)


NIFTY ITHeading toward 51200 after breakout of cup and handle level of 38000 and with fibo ext also we get the same target .Nifty IT can give legs to nifty in getting to next level .
