Nifty Smallcap Index can go upto 12,450With Fib retracement Nifty small cap index has potential to reach 12,450
It will have following targets.
14800 / 14100 / 13850 / 13100 / 12450
CNXSMALLCAP trade ideas

CNX SMALL CAP INDEX Small cap index moving in raising channel and it's now in top of the channel, if break we'll see good upmove .

14900 SL WCB for 16520-800-17200 ready to ROAR CNXSMALL CAPView invalid WCB 14900 can keep eye on for the target 16520-16800-17050-200 after closing above 17200 Weekly close reiview more till that buy on dip ... Market is volatile so small crunching is better than nothing....

NIFTY SMALLCAP 100Wave 4 retraced almost 50% of the Wave 3. Wave 5 to new highs is possibly starting now.

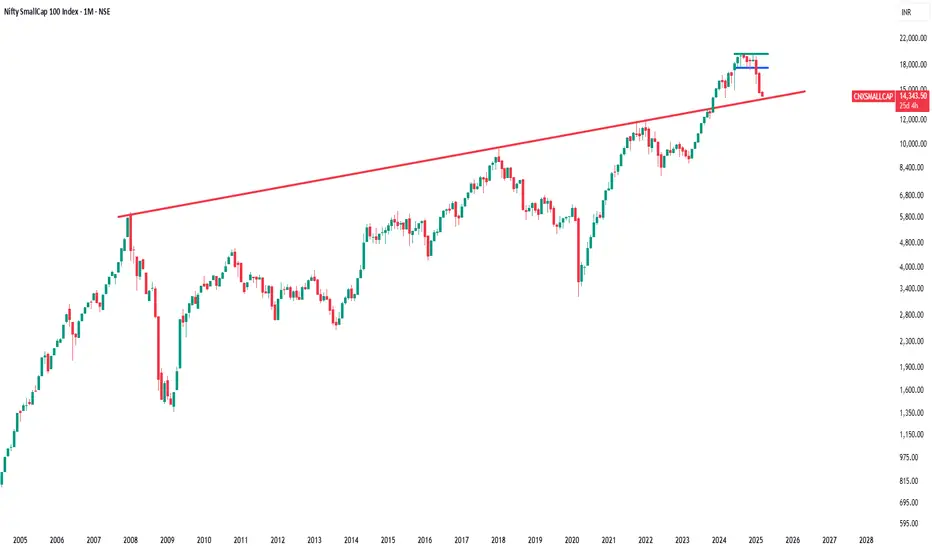
SMALLCAP INDEX TRADING NEAR MULTIYEAR SUPPORTPrevious Multiyear Resistance now act as a Multiyear Support .
Nifty smallcap sectorNifty smallcap sectoral chart is saying the stroy has just begun and not ended. looking for very bright years going forward for investors with PATIENCE.

Small cap: Big relief?The index is showing bullish RSI divergence, the silver lining on charts. The index is also have neared to the support of 15K, so we may see a medium term bottom maybe, lets wait and watch!

Nifty SmallCap 100 Elliot Wave ViewWave 2 of 3: This corrective wave occurred between September 2022 and March 2023, lasting approximately 28 weeks, as highlighted in the chart.
Wave 4's Progression: The recent peak in September suggests symmetry in the cycle, mirroring Wave 2's timeline. If Wave 4 matches Wave 2 in duration (around 28 weeks), the current upward movement could still be part of the corrective Wave 4 rather than a new impulse wave.
Time Symmetry: Considering the reverse channel projection and the similarity in duration with Wave 2, March 2026 emerges as a potential time window for the commencement of Wave 5 of 3, which could lead to a significant breakout beyond the current range.

Mid/Smallcap || Recovery As Expected, What now? The Midcap and Small Cap Index have shown signs of recovery as anticipated in my previous analysis. The index is now trading above the 20 EMA Band in the 2-hour timeframe (TF). However, several key conditions must still be met before we can confirm a sustained bull run:
1. 2-hour RSI should cross above 75 to signal strong upward momentum.
2. Daily timeframe (DTF) RSI needs to exit the Bear Zone.
3. NIFTY50 is still awaiting confirmation to move out of the Bear Zone, which would provide broader market support.

Mid/Smallcap || Nearing Key Reversal Zone?Many traders focus on midcap and small-cap stocks, so this index movements can significantly impact portfolios. However, stock selection is crucial; choosing stocks in a downtrend or sideways movement often limits potential upside.
Index Analysis:
1. RSI for Midcap and Smallcap Index in the daily timeframe (DTF) is close to oversold zone
2. 2hrsTF RSI is already in ovsersold zone, however there’s an RSI positive divergence in the 2-hour chart, a bullish indicator,
3. the index sits within a support zone, suggesting a possible reversal.
Market Outlook:
Limited Downside Expected: Significant further declines in midcap and small-cap may not be likely. Even if they dip, a recovery within the same 2-hour candle is possible.
Key Resistance:
A confirmed bull run may require the RSI to break above 75.
Disclaimer: This is based on my analysis and experience. It’s not investment advice, and market conditions may vary.
Hope for the Best

The beginning of the next bull market.This box represented both the stop-loss and the buying zone. The index closing above the box confirms the start of a new bull run, expected to continue until mid-December. The end of the correction was confirmed yesterday, with most of the selling driven by retail investors.

Expecting a small recovery in equity market.As the index is oversold, expecting a small recovery in equity market. but this not mean a
start of bullish trend but a dead cat bounce.

NIFTY SMALLCAP - Is this ferocious rally fading!NIFTY SMALL CAP RSI is 81 on Monthly chart. Prior to this, RSI has crossed 76 only 4 times on monthly chart and every time it corrected a lot. Everything is clearly mentioned on the chart.
Is it time to be cautious on small cap!

Long term mutual fund/index fund investment strategy INDICATORS: 50MA, 200MA, RSI(14)
CHART:
Index that you are planning to invest in(eg: nifty 50 -> niftybees).
Index that mostly resembles your mutual fund(eg: cnxsmallcap -> smallcap mutual funds).
BUYING SRRATEGY:
When above 50MA, 200MA -> SIP min amt(eg 5000)
When below 50MA, 200MA -> SIP double the min amt(eg 10000)
When 1st dip in RSI(14) below 30 & below 50,200MA -> Lumpsum 6 times the min amt,
When 2nd dip in RSI(14) below 30 & below 50,200MA -> Lumpsum 8 times the min amt,
When 3rd dip in RSI(14) below 30 & below 50,200MA -> Lumpsum 10 times the min amt, so on and so forth.
SELLING STRATEGY:
When 1st rise in RSI(14) above 70 & above 50,200MA -> Sell 4 times the min SIP amt,
When 2nd rise in RSI(14) above 70 & above 50,200MA -> Sell 6 times the min SIP amt,
When 3rd rise in RSI(14) above 70 & above 50,200MA -> Sell 8 times the min SIP amt, so on and so forth.
POINT TO NOTE: Invest throughout the year even when RSI shows overbought. Your investment amount would be the min SIP amount while you'll be selling 4(+) times the min SIP amount hence you'll be net seller.
DISCLAIMER: This has been back tested only on paper and not in real time. I'll be following this strategy starting from june 2024. Modifications can be done in future according to the performance of the strategy.

SMALLCAP INDEX - EXPECTED PATHLook at previous history, I believe there is still good amount of steam left in Smallcap Index stock. I think we will see ATH in September above 12000 and we can extend upto 12500 12600 zones and then sharp fall will be expected in October/November which can be good opportunity for last leg rally towards 15000 zones...
My advice for next 2 months will be to accumulate stocks for next big leg of upside...
My Top picks at current market price or in any dips:-
Strides Pharma: 414 - Expected Target 900
United Drilling Tools: 213 - Expected Target 450 540
EPL: 196 - Expected Target 290
Aegis Logistics: 355 (Holding period 3 years) - 900 plus irrespective of what market does
Vaibhav Global: 385

Bullish in SmallcapAll the details or levels mentioned on chart..
Major support 14000 and above 14950 around levels major resistance..
Below 14000, chances down till 13000 and
Above 14950, chances up till 15900 and more.

Small Cap - Froth Few Away ??? :) :) :)Nifty Small Cap - Remember Madam Madhabi's speech on Mar 11 and the great fall....Marked in BLUE Arrows. We are back to same Level. So, where is the Froth ? Flew away with the wind ?
Look at how many RED LINES (Supports) were broken from Mar 11 till Mar 14th. All of them turned back as Resistances.
Guys - why is no one asking this question yourselves ? If the Market is Indeed weak - Breaking support is ok, but how can it take a V shaped U turn and Break all the Resistances on the upside ? Please don't fall prey to Panic Selling Messages.
Remember - we think we are outsmarting the market, preserving our capital, waiting for market to come down to do bottom fishing. But when the market is falling like crazy - how many of you know when to do Bottom Fishing ? Do you all have confidence to buy when market is still falling ? When market turns back quickly and gives sudden upward move - how many of you feel you missed your entry points ? LC to UCs
I have given so many examples of LC to UCs. We can't time the market, neither can we outsmart the market. We need to Learn to Ride the Tide irrespective of its side. To do that, we need to have conviction first, then follow support and resistances and then make informed and rational decision
I know one thing for sure - very limited folks in this group sold off their positions at levels higher than Mar 11. Many sold after the Mar 11 instigated crash. Now most of our Ex-Holdings would have come above our sell-off zone ? Isn't it
there could always be few exceptions which still might be struggling. Out of my 94 stock portfolio which is Small and Mid Cap heavy - most of them recovered to Pre-Mar 11 levels. And many are not so Fundamentally strong. But how did I get back the recovery ? Because market is not rational between Fundamentals and Technicals always. Over a long run it might equalize, but by that time, I will make my money and say TA TA to those stocks.
Disclaimer:
3+ Years Teaching Experience in Stock Market - Technical Analysis, Advanced Patterns, Emotional Management, News based Trading...
We are NOT SEBI Registered and Our focus is NOT providing Buy/Sell Recommendations/calls. Primary Objective is to provide detailed analysis of how to review a chart, explain multi-timeframe views purely for Educational Purposes.
We strongly suggest our followers to "Learn to Ride the Tide irrespective of its Side"
*** Important *** Consult your Financial Advisors before taking any positions
If you like our detailed analysis, please do rate us with your Likes, Boost and share your comments
-Team Stocks-n-Trends

Nifty Small Cap !!! Cypher patternHello All,
The recommendations are purely for educational purpose only, consult you financial advisor before trading.
Targets are mentioned in charts (either red lines or balck lines), keep Stop Loss as per your risk..
If you like my Idea, Don't forget to Boost and comment on my Analysis..
Have a profitable year ahead
Gautam Khanna
Technical Analyst by Passion :-)


SmallCap: Big shocks?Small cap index is just at the bottom of its channel, this needs to be saved then only we can see it move further northwards. If it breaks 15600, which will confirm the channel BO on downside we may witness 15100 quickly (good probability that it may occur to clear the valuation froth)

Indian Indices - Realize Truth, Ignore Noise (Don't Panic)
Small Cap -
Mid Cap -
Metal -
Nifty IT -
Media -
Realty -
Nifty 50 -
FMCG -
Fin Service -
Bank Nifty -
Whoa What a Day Today !!! A Full Day of Swing Left and Right to extreme levels.
Tell me honestly how many Youtube Channels, Telegram Channels, WhatsApp Groups, Expert Commentaries came today with atleast one of the below Warning Messages
See I told you, Mid Cap and Small Cap are due for Correction and the Correction started today
This is just the Beginning - more pain ahead
Safeguard your Capital, Book SLs on Mid and Small Caps
Book profits on your trading stocks, save capital for a market fall
And what not......
For a Retail Investor - any of the above message will Translate Only into "Panic Selling" and nothing else. Its the prime duty of so called "Market Experts" to paint the right picture, convey the reality in right way without triggering Panic. Else - better to stay away from giving expert advice - because one Panic message completely Destroys any-and-all Profits a small retail trader would have gained for the past 1-2 months.
So, what's the point in giving advice which does not help anyone ??? Now let's review each Index what really happened.
The underlying force which controls the market is Support and Resistance. Whether its a Positive/Negative News or Politics or Profit Booking or FII Activity or US Treasury Bonds - eveything operates within the boundary of One-more Support & Resistances
1. Small Cap
The support levels were shared in our Telegram Channel last week itself. Look how exactly Small cap index tested and rejected from the Support at 16030. And how big is the wick ? Buyers showing strength lifting price up
2. Mid Cap
Once again 2 support levels - 48490 and 48050. One pushed the Wick up and Other was powerful enough to push the Candle Body itself up. Again, Good strength from buyers leading to a Huge Lower Wick
3. Metal
Nifty Metal index had the Biggest Fall among Nifty Peers. It had a Flag Pattern BO recently and did a BO-Retest today and found support from 2 levels in the flag (Flag Top and Flag Middle) and the support was strong enough to push the Price higher than the Flag top. So, Still Bullish....
4. Nifty IT
After finishing a Big Rounding Bottom on Weekly, it formed a smaller Rounding Bottom on Daily and after Breaking that as well - it came back to Retest the BO zone. See very clearly the BO zone providing the needed support for IT index. So, this is also in Bullish mode despite the Red candle
5. Media
Nifty Media formed a Bearish Double Top pattern on Weekly, but taking support at 2115 - look at the strong bounce. The big fall this week got negated by a Stronger Bullish Green candle. Amazing recovery. There are 3 back to back supports - 2115, 2050, followed by Parallel Channel Trendline around 1950 zone. Until all 3 are broken down - Media sector is BULLISH
6. Realty
Nifty Realty formed a Perfect Double Top pattern at 895, but took beautiful support at 875 finally ending up in a Perfect Hammer Pattern which is bullish reversal indicator
7. Nifty 50
I have been screaming of the support zones in Nifty at 21780, 21725 ever since Channels were cautioning about Big fall coming. Look how 21725 gave the push today. Both on Daily and Weekly scale - only Wick below the support levels. On Weekly - the price is comfortably above both support levels - yet people keep passing Panic Messages
8. FMCG
On weekly - its a Perfect Rounding Bottom BO followed by a perfect Retest. Finally the price did end ABOVE the BO zone
9. Fin Service
Fin Service formed a Gap between 20570 and 20255. The Cavity got Finally filled (as expected) multiple times and price took support form the Long term Parallel Channel Trendline for 2nd time. Strong bounce today - until price falls below 19910 and 19775 - sector is Bullish
10. Bank Nifty
The Leader among the Nifty Peers. Strong 620 points up. Same as Fin Nifty - Cavity Filling done and Support Taken from long term parallel Channel trendline
Folks - Now tell me - 10 Sectoral Indices have been reviewed here. Nothing Bearish. Yet there is ONLY noise in the entire market, all channels giving instructions to Book Profits, execute Stop Loss. Why ?
The Channel Admins, Big Players, Brokerages have so much funds to take on small SLs and rotate their funds, but for small Retail players - even a small SL will destroy their investable principal. Even if you are doing Swing Trading - why to book SLs when the stock is not going Bankrupt ? It will take few days to weeks for the same stocks to recover and you will repent for booking SLs there.
Before taking decision on SL booking - following instructions must be followed
Wait for Weekly Close
Check all your stocks to see how bad the support levels are broken
Check where is the next support level
Only when the next support level is too far down - take a conscious decision to book SLs. Else close your trading terminal and take some rest. market will do its magic recovery
Disclaimer:
Stocks-n-Trends is NOT a SEBI registered company. We do not provide Buy / Sell recommendations - rather we provide detailed analysis of how to review a chart, explain multi--timeframe views purely for Educational Purposes. We strongly suggest our followers to "Learn to Ride the Tide" and consult your Financial Advisors before taking any positions.
If you like our detailed analysis, please do rate us with your Likes, Boost and share your comments
-Team Stocks-n-Trends

The Royal Trapping of Retailers - Pre-warnedOn Dec 20 - almost 10+ sectors in Nifty faced their individual resistances together - which " Triggered " a coordinated sell-off.
I once again say the word - Trigger because FIIs and DIIs just kick started a sell-off and Retailer investors fell into the trap when they saw all their stocks across sectors started falling together. Just panic selling. At the end of the day FIIs and DIIs bought all the stocks resulting in Net +3000 crore of Buy activity despite major fall across all sectors
I wrote a 8-part article already about this on same day. Additionally I Pre-warned on Dec 31 that similar situation is expected to happen on Jan 1st week as 6 out of 13 sectors are meeting their long term resistances together.
Today - it came to Life. Another big round of sell-off across many sectors but net activity of FIIs and DIIs are both on BUY side. So who got fooled ? Who got trapped Royally?? It's us the Retail investors who once again don't have the perseverance, the technical knowledge of charts , the conviction on their own portfolio falling prey to Panic Selling.
We need to " Learn to Ride the Tide irrespective of its Side "
Thats the moto of our group - Stocks-n-Trends
Team Stocks-n-Trends
