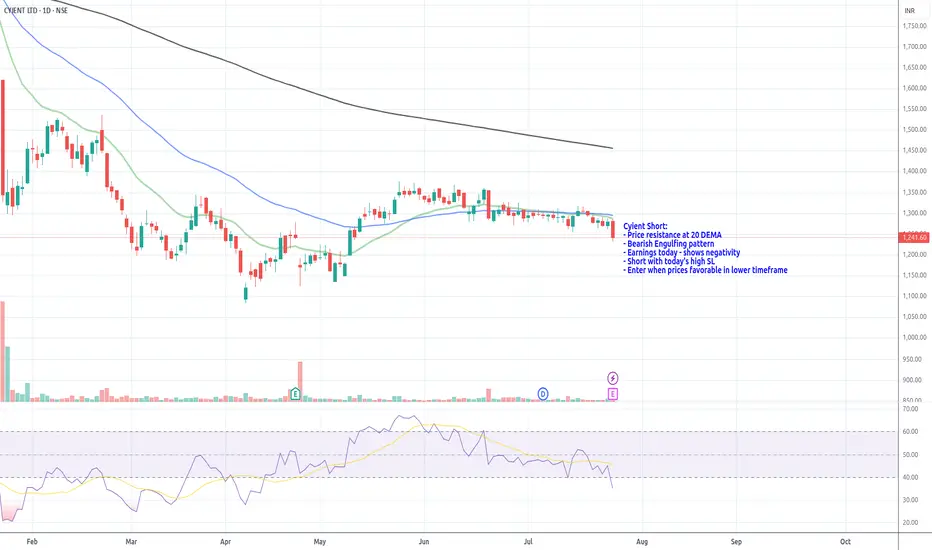
Cyient Short_Resistance @ 20 DEMACyient Short:
- Price resistance at 20 DEMA
- Bearish Engulfing pattern
- Earnings today - shows negativity
- Short with today's high SL
- Enter when prices favorable in lower timeframe
Next report date
—
Report period
—
EPS estimate
—
Revenue estimate
—
56.85 INR
6.16 B INR
73.60 B INR
80.78 M
About CYIENT LTD
Sector
CEO
Sukamal Banerjee
Website
Headquarters
Hyderabad
Founded
1991
ISIN
INE136B01020
FIGI
BBG000BV0H73
Cyient Ltd. is engaged in the provision of software enabled engineering and GIS services. It operates through the following segments: Digital, Engineering and Technology, Design Led Manufacturing, and Others. The Digital, Engineering & Technology segment includes transportation, connectivity, sustainability and new growth areas. The Design Led Manufacturing segment involves in the electronic manufacturing solutions in the fields of medical, industrial, automotive, telecommunications, defense, and aerospace applications including manufacture and machining of components for aerospace, automotive, and defense industries. The company was founded by Bodanapu Venkata Ram Mohan Reddy, B. Sucharitha, and K. Rajan Babu on August 28, 1991 and is headquartered in Hyderabad, India.
Related stocks
GANN SQ9+ INV H&S + FIBO The inverted head and shoulder pattern can be observed in the chart. It is a bullish reversal chart pattern indicating potential shift from downtrend to uptrend. The green horizontal line was the support that was broken with a gap and is the potential target for the bulls to reach. The Fibonacci ret

Potential Multibagger Cyient LtdWave pattern shows I-II, 1-2 move is going to end once break out of falling wedge happens.
It is at the initiation of wave 3 of III.
Good to accumulate for multibagger returns in long term.
Do your own due diligence before taking any action.
Peace!!

Cyient 1DCyient is currently trading at ₹1,144. If the price sustains above the ₹1,200 level, there is a strong potential for it to rally towards the ₹1,600 mark.
Disclaimer: The information provided is for educational and informational purposes only and should not be considered as financial advice. Inves

CYIENT Trade Setup Analysis: Risk-to-Reward and Key ZonesThis analysis outlines a trade setup observed on the chart based on technical price action and supply-demand dynamics. Please note, this is not investment advice but a learning perspective. Below is a detailed breakdown of the idea:
Demand Zone (DZ):
A key demand zone has been identified in the ra


GOING TO ALL TIME HIGH...NSE:CYIENT trade at 2130 level. You can watch for an upside movement till its ALL TIME HIGH LEVEL at 2400.

CYIENTHi guys,
In this chart i Found a Demand Zone in CYIENT CHART for Positional entry,
Observed these Levels based on price action and Demand & Supply.
*Don't Take any trades based on this Picture.
... because this chart is for educational purpose only not for Buy or Sell Recommendation..

cyientestablished a new subsidiary called Cyient Semiconductors, according to a Friday filing to the Indian stock exchanges.
According to a board approval received in July, the subsidiary will be engaged in end-to-end turnkey ASIC (semiconductor design and chip sales through a fabless model) business.

Flag chart pattern.Flag chart patterns Breakout price 2,050. Stop loss 1,990 , First Target 2,180 /Second Target 2,250 /Third Target 2,350 ,This chart already breakout /2,00 DMA .This particular chart accuracy
80.%.

See all ideas
Summarizing what the indicators are suggesting.
Neutral
SellBuy
Strong sellStrong buy
Strong sellSellNeutralBuyStrong buy
Neutral
SellBuy
Strong sellStrong buy
Strong sellSellNeutralBuyStrong buy
Neutral
SellBuy
Strong sellStrong buy
Strong sellSellNeutralBuyStrong buy
An aggregate view of professional's ratings.
Neutral
SellBuy
Strong sellStrong buy
Strong sellSellNeutralBuyStrong buy
Neutral
SellBuy
Strong sellStrong buy
Strong sellSellNeutralBuyStrong buy
Neutral
SellBuy
Strong sellStrong buy
Strong sellSellNeutralBuyStrong buy
Displays a symbol's price movements over previous years to identify recurring trends.
Frequently Asked Questions
The current price of CYIENT is 1,181.90 INR — it has decreased by −1.97% in the past 24 hours. Watch CYIENT LTD stock price performance more closely on the chart.
Depending on the exchange, the stock ticker may vary. For instance, on NSE exchange CYIENT LTD stocks are traded under the ticker CYIENT.
CYIENT stock has fallen by −2.56% compared to the previous week, the month change is a −9.15% fall, over the last year CYIENT LTD has showed a −32.85% decrease.
We've gathered analysts' opinions on CYIENT LTD future price: according to them, CYIENT price has a max estimate of 1,730.00 INR and a min estimate of 1,050.00 INR. Watch CYIENT chart and read a more detailed CYIENT LTD stock forecast: see what analysts think of CYIENT LTD and suggest that you do with its stocks.
CYIENT reached its all-time high on Dec 22, 2023 with the price of 2,458.95 INR, and its all-time low was 184.00 INR and was reached on May 22, 2020. View more price dynamics on CYIENT chart.
See other stocks reaching their highest and lowest prices.
See other stocks reaching their highest and lowest prices.
CYIENT stock is 4.15% volatile and has beta coefficient of 1.56. Track CYIENT LTD stock price on the chart and check out the list of the most volatile stocks — is CYIENT LTD there?
Today CYIENT LTD has the market capitalization of 130.20 B, it has increased by 0.73% over the last week.
Yes, you can track CYIENT LTD financials in yearly and quarterly reports right on TradingView.
CYIENT LTD is going to release the next earnings report on Oct 16, 2025. Keep track of upcoming events with our Earnings Calendar.
CYIENT earnings for the last quarter are 13.95 INR per share, whereas the estimation was 13.37 INR resulting in a 4.36% surprise. The estimated earnings for the next quarter are 14.63 INR per share. See more details about CYIENT LTD earnings.
CYIENT LTD revenue for the last quarter amounts to 17.12 B INR, despite the estimated figure of 18.05 B INR. In the next quarter, revenue is expected to reach 19.09 B INR.
CYIENT net income for the last quarter is 1.54 B INR, while the quarter before that showed 1.70 B INR of net income which accounts for −9.74% change. Track more CYIENT LTD financial stats to get the full picture.
CYIENT LTD dividend yield was 2.06% in 2024, and payout ratio reached 46.47%. The year before the numbers were 1.50% and 48.20% correspondingly. See high-dividend stocks and find more opportunities for your portfolio.
As of Aug 2, 2025, the company has 12.02 K employees. See our rating of the largest employees — is CYIENT LTD on this list?
EBITDA measures a company's operating performance, its growth signifies an improvement in the efficiency of a company. CYIENT LTD EBITDA is 11.09 B INR, and current EBITDA margin is 15.65%. See more stats in CYIENT LTD financial statements.
Like other stocks, CYIENT shares are traded on stock exchanges, e.g. Nasdaq, Nyse, Euronext, and the easiest way to buy them is through an online stock broker. To do this, you need to open an account and follow a broker's procedures, then start trading. You can trade CYIENT LTD stock right from TradingView charts — choose your broker and connect to your account.
Investing in stocks requires a comprehensive research: you should carefully study all the available data, e.g. company's financials, related news, and its technical analysis. So CYIENT LTD technincal analysis shows the strong sell today, and its 1 week rating is strong sell. Since market conditions are prone to changes, it's worth looking a bit further into the future — according to the 1 month rating CYIENT LTD stock shows the sell signal. See more of CYIENT LTD technicals for a more comprehensive analysis.
If you're still not sure, try looking for inspiration in our curated watchlists.
If you're still not sure, try looking for inspiration in our curated watchlists.