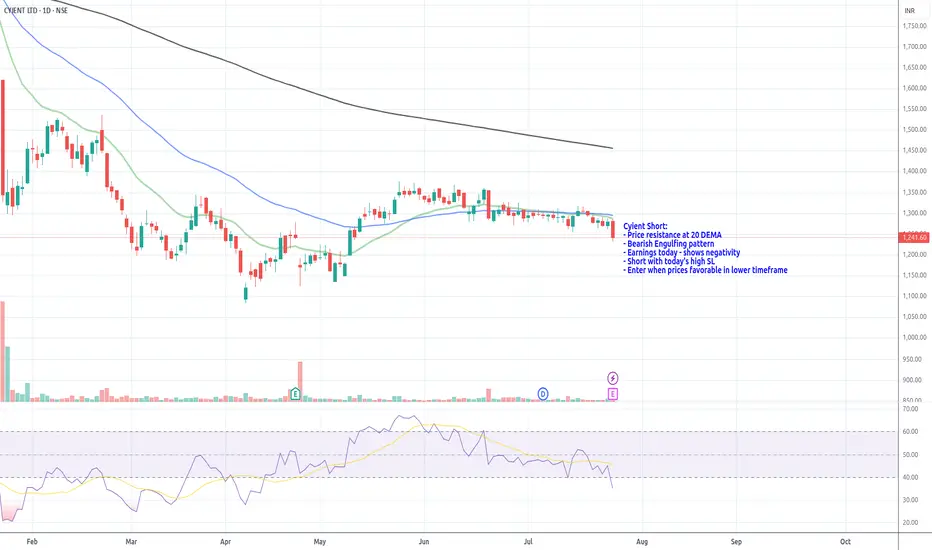
Cyient Short_Resistance @ 20 DEMACyient Short:
- Price resistance at 20 DEMA
- Bearish Engulfing pattern
- Earnings today - shows negativity
- Short with today's high SL
- Enter when prices favorable in lower timeframe
CYIENT trade ideas
GANN SQ9+ INV H&S + FIBO The inverted head and shoulder pattern can be observed in the chart. It is a bullish reversal chart pattern indicating potential shift from downtrend to uptrend. The green horizontal line was the support that was broken with a gap and is the potential target for the bulls to reach. The Fibonacci retracement from 1807 to 1084.05 provide important levels for the bulls to watch for. The GANN Sq9 provide near term support and resistances .

Potential Multibagger Cyient LtdWave pattern shows I-II, 1-2 move is going to end once break out of falling wedge happens.
It is at the initiation of wave 3 of III.
Good to accumulate for multibagger returns in long term.
Do your own due diligence before taking any action.
Peace!!

Cyient 1DCyient is currently trading at ₹1,144. If the price sustains above the ₹1,200 level, there is a strong potential for it to rally towards the ₹1,600 mark.
Disclaimer: The information provided is for educational and informational purposes only and should not be considered as financial advice. Investing in the stock market involves risk, and past performance is not indicative of future results. Please consult with a certified financial advisor or conduct your own research before making any investment decisions. We are not responsible for any losses incurred as a result of using this information. Stock market investments are subject to market risks; read all related documents carefully.

CYIENT Trade Setup Analysis: Risk-to-Reward and Key ZonesThis analysis outlines a trade setup observed on the chart based on technical price action and supply-demand dynamics. Please note, this is not investment advice but a learning perspective. Below is a detailed breakdown of the idea:
Demand Zone (DZ):
A key demand zone has been identified in the range of 1869.65 - 1879.90, indicating a strong area where buyers stepped in previously, causing a significant price rally. This zone serves as a potential support area, providing a base for further upward movement.
Entry Point:
The suggested entry for this trade is at 1938.00, marked after the price successfully tested the demand zone and showed signs of bullish reversal. This ensures entering the trade as momentum shifts upward, reducing risk.
Stop Loss:
To manage risk, the stop-loss level is set at 1862.30. This level is placed slightly below the demand zone to account for minor price fluctuations while safeguarding capital in case the price breaks below the support zone.
Target Price:
The target for this trade is defined at 2090.00, providing a potential upside of 152 Rs. This level aligns with historical resistance or a logical area where profit-taking might occur.
Risk-to-Reward (RR):
The RR for this trade is calculated at 2.01, making it a favorable setup. This implies that for every unit of risk taken, there is a potential to gain more than 2x in returns.
Technical Signals:
Bullish Engulfing: A strong green candle emerged near the demand zone, signaling renewed buying interest.
Momentum Shift: Indicators suggest increased bullish momentum, aligning with the entry point for this setup.
Trend Continuation: Price action reflects higher highs and higher lows post-reversal, hinting at a potential continuation of the upward trend.
Key Considerations:
Always use proper position sizing to avoid risking more than you can afford to lose.
This analysis is shared purely for educational purposes, and no guarantee of success is implied.
External factors, such as market news or global events, may impact the setup's outcome.
Trade safely and continue learning!


GOING TO ALL TIME HIGH...NSE:CYIENT trade at 2130 level. You can watch for an upside movement till its ALL TIME HIGH LEVEL at 2400.

CYIENTHi guys,
In this chart i Found a Demand Zone in CYIENT CHART for Positional entry,
Observed these Levels based on price action and Demand & Supply.
*Don't Take any trades based on this Picture.
... because this chart is for educational purpose only not for Buy or Sell Recommendation..
Thank you

cyientestablished a new subsidiary called Cyient Semiconductors, according to a Friday filing to the Indian stock exchanges.
According to a board approval received in July, the subsidiary will be engaged in end-to-end turnkey ASIC (semiconductor design and chip sales through a fabless model) business.

Flag chart pattern.Flag chart patterns Breakout price 2,050. Stop loss 1,990 , First Target 2,180 /Second Target 2,250 /Third Target 2,350 ,This chart already breakout /2,00 DMA .This particular chart accuracy
80.%.

CYIENTCYIENT: Perfect candidate for low risk swing trade
1) Strong support, price moving up with range expansion and supported by volume
2) Higher High printed on chart after 9 months
3) Wait for bullish price action at these levels
4) Nothing much on other aspects

CYINT !! Reversal startedCYINT !! Reversal started,
- All sellers volume is absorbed and made double bottom in weekly chart

CYIENT LONGCYIENT LONG is suggested
Price is getting support from Daily Demand 1747-1650
Price is supported by strong Daily Demand
Overall PRice Trend is Up in Bigger Time Frame
We can Traget 2100 Level from current CMP

SWING IDEA - CYIENT Cyient , a global engineering and technology solutions company, is displaying technical indicators that suggest a potential swing trading opportunity.
Reasons are listed below :
1700 Support Zone : The 1700 level has been established as a strong support zone, providing a solid base for potential upward movement.
Double Bottom Pattern : The formation of a double bottom pattern indicates a potential reversal from the downtrend, signaling a bullish outlook.
Bullish Hammer Candle on Weekly Timeframe : The presence of a bullish hammer candle on the weekly chart suggests a reversal in sentiment from bearish to bullish, indicating strong buying pressure.
Engulfed 6 Weekly Candles : A recent bullish candle has engulfed the previous 6 weekly candles, demonstrating significant buying interest and a potential shift in trend.
0.382 Fibonacci Support : The stock is finding support at the 0.382 Fibonacci retracement level, a key area where prices often bounce back, indicating potential for an upward move.
50 EMA Support : The stock is supported by the 50-week exponential moving average (EMA), reinforcing the bullish sentiment and providing a strong support level.
Target - 2190 // 2460
Stoploss - weekly close below 1660
Disclaimer :
Decisions to buy, sell, hold or trade in securities, commodities and other investments involve risk and are best made based on the advice of qualified financial professionals. Any trading in securities or other investments involves a risk of substantial losses. The practice of "Day Trading" involves particularly high risks and can cause you to lose substantial sums of money. Before undertaking any trading program, you should consult a qualified financial professional. Please consider carefully whether such trading is suitable for you in light of your financial condition and ability to bear financial risks. Under no circumstances shall we be liable for any loss or damage you or anyone else incurs as a result of any trading or investment activity that you or anyone else engages in based on any information or material you receive through TradingView or our services.
@visionary.growth.insights

CYIENT--Cyient Ltd. has recently formed a symmetrical triangle pattern on its weekly and daily candlestick chart. This pattern is characterized by converging trend lines, indicating a period of consolidation before a potential breakout. forming higher low also .

Cyient Ltd, Bullish, Kindly do your own studyCyient Ltd is looking bullish in higher time frame.
5 Monthly price is challenged upper BB
Monthly price has retraced and price is above 5 EMA now.
Monthly MACD has not given negative crossover
Monthly RSI is above 60
Weekly price has taken 50 EMA with bullish candle. Price is above 6 weeks high and ABC correction seems to be over.
Weekly RSI is above 40 and RBD is there.
Weekly MACD has RBD
Weekly Stochastic has given PCO from over sold zone after longtime.
Daily price is in momentum and volume is high
Daily RSI is above 60

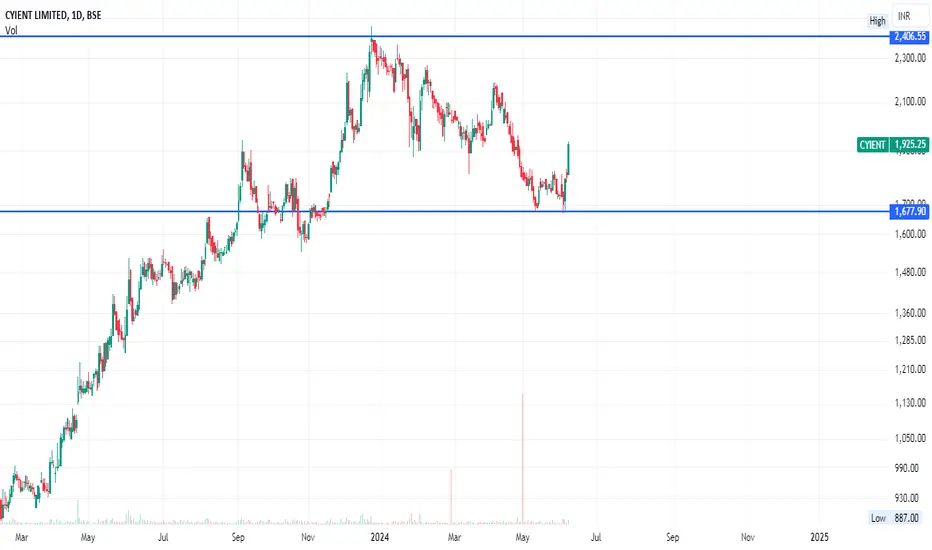
Alteast double top candidatebased on good fundamental
based on good topline and bottom line growth
Highest ever profit and revenue
prices are expected to go minimum double top.
SWING IDEA - CYIENTA potential swing trade opportunity in Cyient , a leading global engineering solutions provider, renowned for its innovative approaches and commitment to sustainability.
Reasons are listed below :
The stock is currently retesting the significant resistance level of 1800, which historically served as a strong barrier. This retest could indicate a potential breakout.
A dragonfly doji candlestick pattern has formed on the weekly timeframe, suggesting a potential reversal from bearish to bullish sentiment.
Cyient found support at the 0.382 Fibonacci level, providing additional confirmation of a potential reversal.
The stock has been consistently forming higher highs, indicating an upward trend in price action.
Target - 2366 // 2860
Stoploss - weekly close below 1800
DISCLAIMER -
Decisions to buy, sell, hold or trade in securities, commodities and other investments involve risk and are best made based on the advice of qualified financial professionals. Any trading in securities or other investments involves a risk of substantial losses. The practice of "Day Trading" involves particularly high risks and can cause you to lose substantial sums of money. Before undertaking any trading program, you should consult a qualified financial professional. Please consider carefully whether such trading is suitable for you in light of your financial condition and ability to bear financial risks. Under no circumstances shall we be liable for any loss or damage you or anyone else incurs as a result of any trading or investment activity that you or anyone else engages in based on any information or material you receive through TradingView or our services.
@visionary.growth.insights

Falling wedge on CYIENTCYIENT formed a falling wedge pattern on daily chart. Multiple support and resistance levels were tested before the price broke out of resistance. Currently, the price is being retested with current support level (previously resistance). Note the high volume on breakout and subsequent low volume when price falls signaling sellers are dried out. CYIENT had a strong runup prior to the pattern formation. Entry can be above the high of breakout candle with stop loss around the low of breakout candle.
Hope you liked this idea. If so, please boost this idea or leave a comment on what you think. I'll be glad to hear from you. Otherwise happy trading :-).

CYIENT- BUY EDUCATION PURPOSE ONLYCyient Ltd. is engaged in the provision of software enabled engineering and GIS services
1.STRONG SUPPORT 1542.1 AS DAY
2.SWING HIGH 2458.95
3.RETRACEMENT 61.8 % CROSSED
4.TREND LINE 3 TOUCH POINT PERFECT & BREAK OUT
WITH GOOD VOLUME
5.PRICE ACTION PATTERN-PENNANT
6.SL-1892.95/TGT- 2388 ,
7.LONG TIME TGT AS PER PRICE ACTION PATTERN -2995/-

Falling wedge on CYIENTCYIENT formed a falling wedge pattern on daily chart. With multiple support and resistance tested. It had a clear breakout supported by strong volume. Though overall market was negative today CYIENT seems to outperform the market. Good candidate for a swing. Stop loss can be held just below breakout candle with target the size of broader edge of wedge.
If you like this idea, please boost this idea or leave a comment down on what you think. I'll happy to hear from you. Otherwise happy trading :-)

#Cyient long ideaStock have corrected as much as it wanted. Now after forming base it have given break-out of its base and falling trend line. Volume guttering is too good before giving break-out and breakout candle. It's only for education purpose. I will not be liable for your anyone lose.

Cyient potential 18% bullish move Cyient has been moving in a zone of support and resistance. A triangle pattern has occurred and there's a potential breakout that could occur if Cyient picks up bullish momentum. Price is currently also around an area of volume imbalance so its likely to get pushed up. There is also a bearish F.V.G. at around 2155, if price starts moving up and doesn't get affected by the bearish F.V.G at around this level it could have a potential 18% move to the upside.
Disclaimer: I am not a SEBI registered analyst/consultant and not recommending anyone to take any BUY or SELL position in stock market. Investing in stock market is risky and one should do a self analysis and validation before investing in stock market. Consider this idea for educational purposes only.
