Dabur looking bullish above 520Dabur stock looking very bullish above 520 price range
If a good candle close decisively above range a good momentum is expected.
keep an eye above 520 very very bullish above that range.
DABUR trade ideas

Technical Analysis: Price Breakout and BeyondHello Friends,
Welcome to RK_Chaarts,
Let's try to analyze a stock from the FMCG sector, "Dabur India Limited".
Elliott Wave perspective.
We can see that the correction is completed, which is the IVth wave of the monthly time frame of cycle degree in Red. Now, possibly the impulse wave Vth had start unfolding. If we go inside that, we'll see its five sub-divisions in black, labeled ((1))-((2))-((3))-((4))-((5)) of primary degree.
Possibly, wave ((1)) has started unfolding, and within wave ((1)), we'll see five sub-divisions in blue, which is the intermediate degree. Within this, waves (1) and (2) looks complete, and wave (3) has started, which has also broken out of the curve line.
Invalidation level
If our wave counts are correct, the bottom level of wave IV, which is 433, will be our main invalidation level. If the price goes below this level, it will trigger the invalidation level. If that happens, we'll need to re-analyze the chart from a wave count perspective.
But if the price stays above this invalidation level, then our view, which is based on the analysis, will remain bullish, and the chart will remain bullish.
Projected Target
As per Elliott wave theory, it can show new ATH in Long Term, only if Invalidation level is not breached.
Breakout with good Intensity of Volumes
The breakout has a good intensity of volume. The volume in the breakout candle is looking very good, which is 3-4 times higher than the average. This means that market participation is very good during this breakout. So, Conviction is high on this breakout.
We can clearly see that the price has closed above the 50 Exponential Moving Average (EMA), 100 EMA, and 200 EMA, which is a very good sign that the price has overcome all these hurdles along with Breakout.
Now, if there are any hurdles above, they could be the 200 EMA on the weekly time frame, which is coming near the level of 529, and the 50 EMA on the monthly time frame, which is coming near the price of 527. Currently, the price is trading around 513.
Once it crosses 529 or 530, it may show even more strength after that.
Dow Theory Trend confirmation
Based on Dow Theory, if we observe, the price which was falling and making lower highs and lower lows, has now started forming a Higher High and Higher Low pattern on the daily time frame, which is again a sign of bullishness.
Standard Deviation crossed
Price is trading above the mid-Bollinger Band on the weekly time frame, i.e., in the bullish territory. On the daily time frame, Prince has also crossed the upper Bollinger Band, meaning it has broken out and is expanding above the upper Bollinger Band, which is a bullish sign
Supporting Indicators
On the daily time frame, a very good breakout is visible inside RSI, and is also moving above 72. Additionally, on both the daily and weekly time frames, the MACD has given a positive crossover.
Before making any trading decisions, please conduct your own analysis or consult with a technical expert or financial consultant.
I am not Sebi registered analyst.
My studies are for educational purpose only.
Please Consult your financial advisor before trading or investing.
I am not responsible for any kinds of your profits and your losses.
Most investors treat trading as a hobby because they have a full-time job doing something else.
However, If you treat trading like a business, it will pay you like a business.
If you treat like a hobby, hobbies don't pay, they cost you...!
Hope this post is helpful to community
Thanks
RK💕
Disclaimer and Risk Warning.
The analysis and discussion provided on in.tradingview.com/u/RK_Chaarts/ is intended for educational purposes only and should not be relied upon for trading decisions. RK_Chaarts is not an investment adviser and the information provided here should not be taken as professional investment advice. Before buying or selling any investments, securities, or precious metals, it is recommended that you conduct your own due diligence. RK_Chaarts does not share in your profits and will not take responsibility for any losses you may incur. So Please Consult your financial advisor before trading or investing.

Dabur India Ltd view for Intraday 8th May #DABUR Dabur India Ltd view for Intraday 8th May #DABUR
Resistance 485-486 Watching above 486 for upside movement...
Support area 480 Below 480 ignoring upside momentum for intraday
Watching below 477 for downside movement...
Above 485 ignoring downside move for intraday
Charts for Educational purposes only.
Please follow strict stop loss and risk reward if you follow the level.
Thanks,
V Trade Point

Dabur india Upside Breakout: If the stock breaks out above the trendline, a bullish move may be expected.
Downside Breakdown: If the stock gets rejected and falls, it may move downward further.
If you find this helpful and want more FREE forecasts in TradingView, Hit the 'BOOST' button
Drop some feedback in the comments below! (e.g., What did you find most useful?
How can we improve?)
Your support is appreciated!
Now, it's your turn!
Be sure to leave a comment; let us know how you see this opportunity and forecast.
Have a successful week
DISCLAIMER: I am NOT a SEBI registered advisor or a financial adviser. All the views are for educational purpose only

Dabur India Ltd view for Intraday 2nd May #DABUR Dabur India Ltd view for Intraday 2nd May #DABUR
Resistance 490 Watching above 492 for upside movement...
Support area 480 Below 479 ignoring upside momentum for intraday
Watching below 485 for downside movement...
Above 485 ignoring downside move for intraday
Charts for Educational purposes only.
Please follow strict stop loss and risk reward if you follow the level.
Thanks,
V Trade Point

DABUR : Going Long for about 1.25% of the net capitalTook this position for about 1.25% of the net capital. Will consider adding on to the position if price crashes to the lower trendline of the shorter time-frame descending channel.
As of now, targeting the high of the HTF channel for a move of about 35% from the entry level.
📢📢📢
If my perspective changes or if I gather additional fundamental data that influences my views, I will provide updates accordingly.
Thank you for following along with this journey, and I remain committed to sharing insights and updates as my trading strategy evolves. As always, please feel free to reach out with any questions or comments.
Other posts related to this particular position and scrip, if any, will be attached underneath. Do check those out too.
Disclaimer : The analysis shared here is for informational purposes only and should not be considered as financial advice. Trading in all markets carries inherent risks, and past performance is not indicative of future results. It’s essential to conduct your own research and assess your risk tolerance before making any investment decisions. The views expressed in this analysis are solely mine. It’s important to note that I am not a SEBI registered analyst, so the analysis provided does not constitute formal investment advice under SEBI regulations.

DABURDabur presents a buying opportunity for a swing trade, based on current technical analysis. The support level for Dabur appears to be strong and well-established, suggesting a potential upward movement. We are setting target prices of 600 and then 660 for this trade. The recommendation is to initiate a buy position at the 500 level, capitalizing on the anticipated price increase within the specified target range. This strategy aims to profit from short-term price fluctuations, leveraging the apparent support and projected upward trajectory.

#DABUR DEMAND ZONEIf you're analyzing Dabur India (DABUR) for a potential demand zone, here's a detailed guide on how to identify and analyze demand zones using technical analysis. A demand zone is an area on the chart where buying interest is strong, causing the price to reverse upward.

DaburLooks good for filling gap at 600, seems accumulation done.
Wait for results and breakout above 528.

Dabur India Abhi Bhi Mauka Hai Buy Karne Ka Here’s a detailed profile of **Dabur India Limited**:
---
### **Company Overview**
**Dabur India Limited** is one of India’s largest and most trusted FMCG companies with a rich heritage spanning over a century. Known for its expertise in Ayurveda and natural health products, Dabur has become a global leader in the fields of healthcare, personal care, and food products.
---
### **Key Details**
- **Founded**: 1884
- **Founder**: Dr. S.K. Burman
- **Headquarters**: Ghaziabad, Uttar Pradesh, India
- **Chairman**: Amit Burman
- **CEO**: Mohit Malhotra
- **Stock Listings**: Listed on the Bombay Stock Exchange (BSE) and National Stock Exchange (NSE).
---
### **Core Business Segments**
1. **Health Care**:
- Ayurvedic medicines and supplements such as **Dabur Chyawanprash**, **Dabur Honey**, and **Dabur Triphala**.
- OTC products like **Hajmola** and **Honitus**.
2. **Personal Care**:
- Hair care: **Dabur Amla Hair Oil**, **Vatika Hair Care** products.
- Oral care: **Dabur Red Toothpaste**, **Meswak**.
- Skin care: **Gulabari Rose Water**, fairness creams, and moisturizers.
3. **Foods**:
- Juices and beverages under the **Real** and **Real Activ** brands.
- Culinary products like **Hommade** pastes and sauces.
4. **Home Care**:
- Air fresheners, insect repellents like **Odomos** and **Odonil**.
---
### **Manufacturing Facilities**
Dabur operates multiple state-of-the-art manufacturing facilities across India, including:
- **Baddi (Himachal Pradesh)**
- **Pantnagar (Uttarakhand)**
- **Tezpur (Assam)**
- **Katni (Madhya Pradesh)**
Dabur also has international manufacturing units in countries like the UAE, Egypt, and Nigeria to cater to global demand.
---
### **Global Presence**
- Operates in over **120 countries**, with a strong market presence in the Middle East, Africa, South Asia, and the USA.
- Well-known for adapting its Ayurvedic products to international consumer preferences.
---
### **Financial Highlights (2024-25)**
- **Revenue**: Over ₹11,500 crore (USD 1.4 billion approx.).
- **Net Profit**: Consistently growing due to its focus on premium and Ayurvedic products.
- **Market Position**: Among the top FMCG companies in India.
---
### **Sustainability Initiatives**
- Dabur is committed to sustainability through its **"Environment Commitment"**:
- Reduction of plastic waste via recycling programs.
- Use of eco-friendly packaging.
- Planting millions of trees under its corporate social responsibility (CSR) initiatives.
- Focused on creating Ayurvedic and herbal products with minimal environmental impact.
---
### **Achievements and Recognitions**
- One of the most trusted FMCG brands in India.
- Listed among the **Fortune 500 companies in India**.
- Recognized for its contributions to promoting Ayurveda and natural health care globally.
---
### **Popular Products**
1. **Health Care**:
- **Chyawanprash**, a leading immunity booster.
- **Dabur Honey**, India's largest honey brand.
- Ayurvedic supplements like **Ashwagandha**, **Shilajit**, and **Triphala**.
2. **Personal Care**:
- Hair Oils: **Dabur Amla**, **Vatika Coconut Oil**.
- Toothpaste: **Dabur Red Toothpaste**, **Meswak**.
- Skincare: **Gulabari Rose Water**, fairness and beauty creams.
3. **Food & Beverages**:
- **Real Juices**, the market leader in packaged fruit juices in India.

Dabur at Key Support: Will the Bulls Defend? Dabur India Ltd is trading at ₹524.90, showing a weekly gain of 3.50%. The stock is currently testing a multi-year support zone between ₹480–₹500, a level that has historically acted as a key demand area since 2020.
Key Observations:
Support Zone Strength: The ₹480–₹500 level has consistently supported the price, making it a critical zone to watch for potential reversals or consolidation.
Key Levels:
Resistance: ₹540–₹560
Support: ₹480–₹500
Conclusion:
Dabur is at a pivotal level. The multi-year support zone has a history of initiating reversals, but its ability to hold will determine the stock's next trend. One can monitor price action closely for confirmation of a sustained bounce or potential breakdown.

DABUR INDIA LTD Trade SetupHello,
Trend-Based Analysis. Buy the Dips, Sell The Rallies, Also Following the Trend. Let's see where the Price Action takes us, Riding the wave. Potential trade setups based on trend momentum.
Technical analysis based on trend identification and momentum, Looking for high-probability setups within the prevailing trend.
Analyzing the current market trend and potential future price movement. Focusing on risk management and reward-to-risk ratios.
Details is Mentioned in Chart, Read carefully.. .

DABUR : Upside Potential - Bulls on the way for reversal!⚡Price Analysis:
1️⃣ Strong Demand zone
2️⃣ Price structure is bullish.
3️⃣ Price needs to close above 515 in weekly only then good momentum can be expected
4️⃣ RRR is favourable.
✨ My Expectations:
➡️ Aggressive early entry can be planned at CMP.
➡️ Confirmations are still pending
➡️ 1:3RRR can be expected
4H Charting.
⚠️ Disclaimer: This is NOT a buy/sell recommendation. This post is meant for learning purposes only. Views are personal. Please, do your due diligence before investing.⚠️
Happy trading!✅🚀

DABURAfter breaking Support of 505-510, there was a Liquidity Grab in April 2024 where price reached 490. From there, Dabur rallied to 660-670 levels
Its again trading in the same zone (CMP - 508)
Buy can be initiated above 515
Entry: 515 - 520
SL: 485 - 490
Target 1: 585
Target 2: 660-670 (ATH)
DISCLAIMER: NOT FINANCIAL ADVICE. DO YOUR DUE DILIGENCE BEFORE INVESTING

A short term technical trade Weekly Tf Price is consolidating between a horizontal channel....taken support at lower trendline....Sl below 508 closing basis....Target 620.....only for educational purposes and not any recommendation.....

from 2022 Nov to Nov 2024 , no return :(from 2022 Nov to Nov 2024 , no return :(
bought on Nov 2022
cmp: 555
qtty: 100
investment: 55k/-
Looks like, it was shoowing confirmation up trend with Higher low,
but cound not break above the all time high and it has created a range
for another 1 year before breaking upside.
But on Nov 2024, its again came back to the range without any net gain
from my buying price.

Dabur India Ltd view for Intraday 8th Nov #DABUR Dabur India Ltd view for Intraday 8th Nov #DABUR
Resistance 540. Watching above 541 for upside movement...
Support area 530. Below 528 ignoring upside momentum for intraday
Support 530 .Watching below 528 for downside movement...
Resistance area 540
Above 540 ignoring downside move for intraday
Charts for Educational purposes only.
Please follow strict stop loss and risk reward if you follow the level.
Thanks,
V Trade Point

daburNSE:DABUR
We reiterate a BUY rating on the stock with a TP of INR700 (at 50x P/E on Sep’26).
Rsi is in oversold.
Good stock at discount and now accumalating.

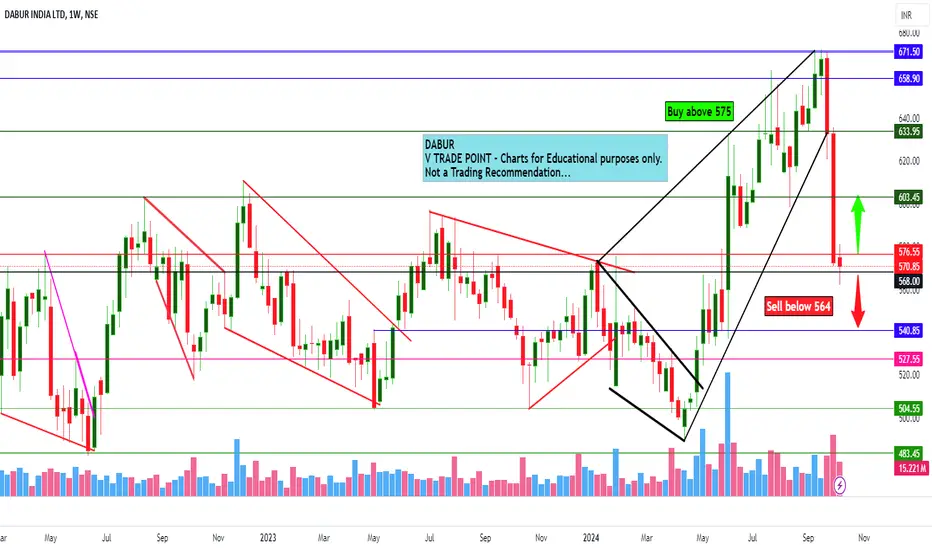
Dabur India ltd view for Intraday 14th October #DABUR Dabur India ltd view for Intraday 14th October #DABUR
Buying may witness above 575
Support area 564-565. Below ignoring buying momentum for intraday
Selling may witness below 564
Resistance area 570-575
Above ignoring selling momentum for intraday
Charts for Educational purposes only.
Please follow strict stop loss and risk reward if you follow the level.
Thanks,
V Trade Point
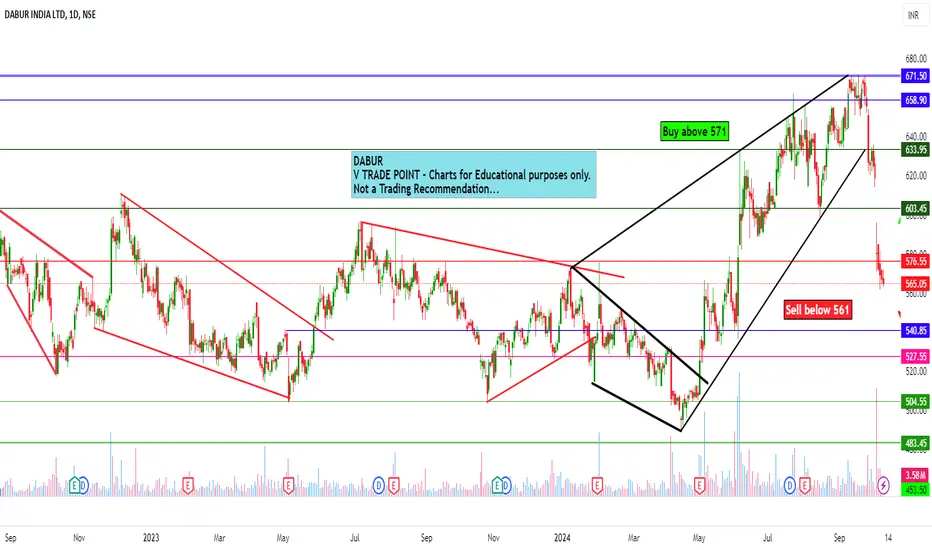
Dabur India Ltd view for Intraday 10th October #DABUR Dabur India Ltd view for Intraday 10th October #DABUR
Buying may witness above 571
Support area 566. Below ignoring buying momentum for intraday
Selling may witness below 561
Resistance area 566
Above ignoring selling momentum for intraday
Charts for Educational purposes only.
Please follow strict stop loss and risk reward if you follow the level.
Thanks,
V Trade Point
DABUR - TOO MANY HURDLES IN THE PATHDabur can re-test 530... The re-test can be bought only when there is bullish confirmation.
As the weekly trendline is tested already for the 4th time, there are bright possibilities of a breakout this time.
Tgts are 576, 590. Once it clears 610 on weekly closing basis, 660 on cards...

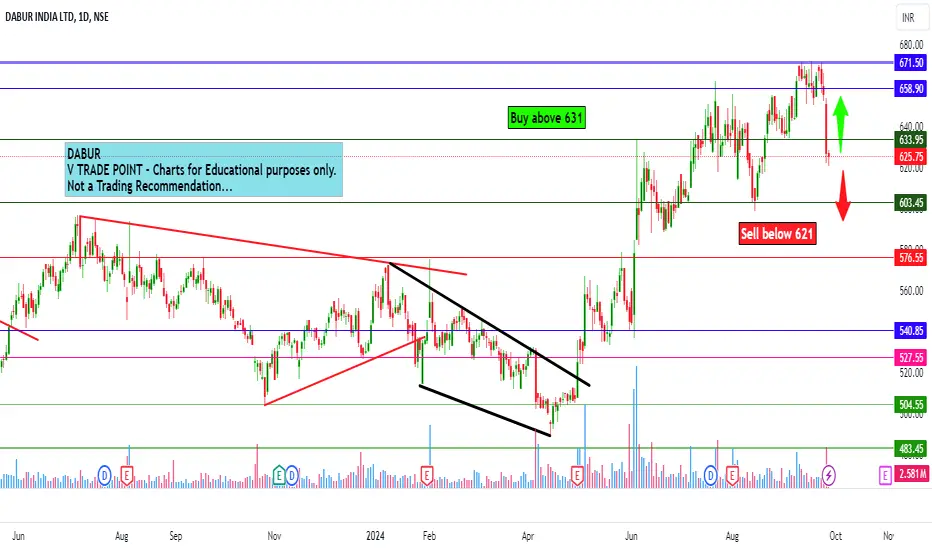
Dabur India Ltd view for Intraday 27th September #HDFCBANK Dabur India Ltd view for Intraday 27th September #HDFCBANK
Buying may witness above 631
Support area 620-621. Below ignoring buying momentum for intraday
Selling may witness below 621
Resistance area 630
Above ignoring selling momentum for intraday
Charts for Educational purposes only.
Please follow strict stop loss and risk reward if you follow the level.
Thanks,
V Trade Point