DABUR AS ON 03.08.2021A GOOD CONFIRMATORY CALL FROM MACD,AND RSI CROSSING 60 !!
A CUP AND HANDLE WAS ALSO FORMED FEW DAYS BACK AND TODAY SHARE REACHED TO HIS TARGET AFTER CUP AND HANDLE!!
TARGET=4-5%
STOP LOSS= GO WITH TRAILING STOP LOSS
(ABOVE ANALYSIS IS ONLY FOR STUDY PURPOSE DO NOT TAKE IT AS ANY BUY OR SELL CALL)
DABUR trade ideas


Dabur Long Term Bullish TradeDabur Long Term Bullish Trade - Investment
It should be Long term trade. Exit only when Weekly MA(14) breaks or Stop Loss of Rs 555 hits.

Stocks to trade on 14Jul2021Dabur after slow and steady up movement now it turned to a downtrend.
As following trade with the trend it is respecting a trendline.
It may take support at 583 and go up again.

Dabur broken the channel support and will be trending down.Dabur has broken the channel support and closed below. Now the immediate support is around 592 followed by 584 and finally 576. So for the coming days it will be in downtrend unless it closes above the W high 605.
Note: This is only for informational purpose and not for trading purpose.
NSE:DABUR


Dabur -- Channel pattern breakoutDabur has given a good breakout. Since 2018 it in channel pattern.
Important levels : 1st target 603 and then 738 and stop loss is 583.

Dabur Multi month Breakout Dabur pattern breakout and all time high
rsi also good
Volumes are also good.
Retest Done.

DABUR can be short DABUR can be short RSI giving negative diversion and rejection from daily time frame channel ressitance.

Dabur India Ltd.The stock is trading in a Regression Channel pattern. Already reached its upper channel highs, in my opinion it will retract back to the lower band of the channel.


Dabur India limitedCup and Handle pattern in Dabur India limited.
A cup and handle price pattern on a security's price chart is a technical indicator that resembles a cup with a handle, where the cup is in the shape of a "u" and the handle has a slight downward drift. The cup and handle is considered a bullish signal, with the right-hand side of the pattern typically experiencing lower trading volume. The pattern's formation may be as short as seven weeks or as long as 65 weeks. - "Investopedia"

DABUR - Cup & handle pattern brekout with good volumeChart is self explanatory.
Don't invest and trade blindly.
Do your own analysis before taking trade.
Note: This is not a stock recommendation.

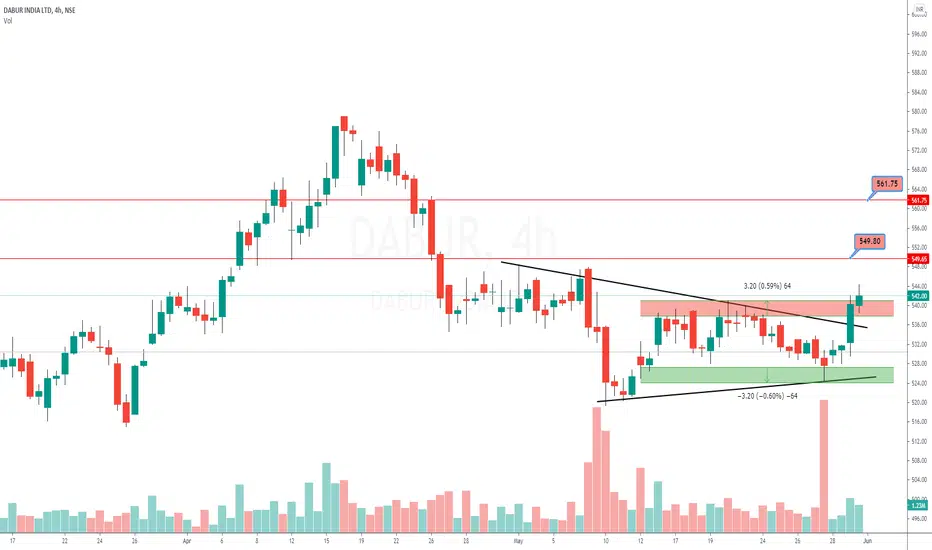
Broken Triangle PatternStock Analysis : Dabur has broken triangle pattern as long as not breaking the demand zone expected target are given on the chart.
Lets' see

dabur double doji
trend bullish
dabur after correction
formed 2 weekly doji
not close below 62% level
sl weekly close below 494
on 8 and 15 march formed double doji and see price action after that
tgt 581
risk to reward almost 1:1
be patient and deploy emotion free capital

