Dalmia Bharat in BreakoutNSE:DALBHARAT in breakout. The Ascending Triangle Pattern is continuing. But at the current Price and Target for 2400
DALBHARAT trade ideas
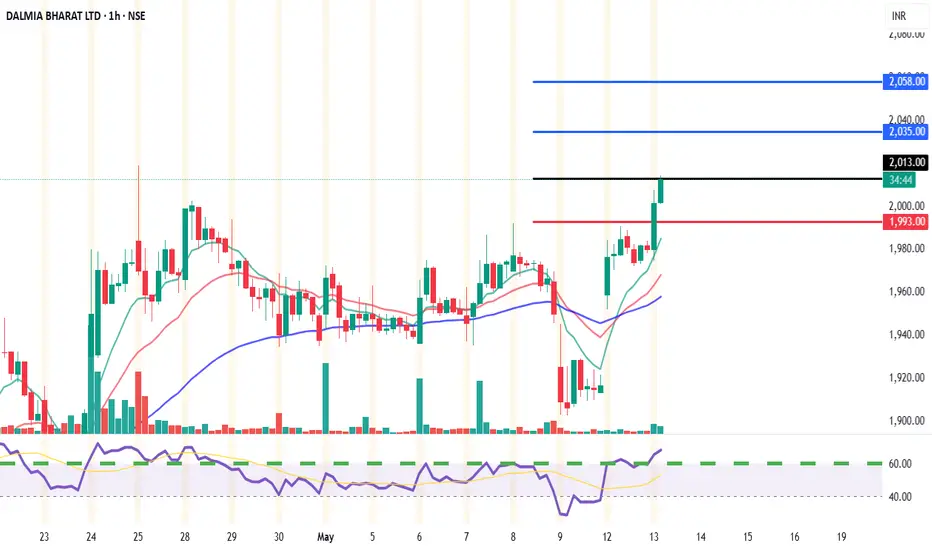
Trade Setup: DALMIA BHARAT (NSE)📊 Chart Summary:
Current Price: ₹2,009
EMA Support: 9 EMA (₹2,003.57) | 26 EMA (₹1,993.31)
Volume: Increasing with bullish candles
Price Action: Sustaining above key pivot and EMA levels
Momentum: Strong with minor consolidation
✅ Intraday Buy Setup (15min & 1h)
Buy Above: ₹2,013.50 (Break of intraday resistance zone)
Targets:
🎯 Target 1: ₹2,035.80 (Pivot R2)
🎯 Target 2: ₹2,058.30 (Pivot R3)
Stop Loss: ₹1,993 (below 26 EMA and pivot zone)
Risk:Reward: ~1:2 or better
For Education Purposes Only
DALBHARAT SWING TRADE📊 Price Action & Trend Analysis
Analyzing market trends using price action, key support/resistance levels, and candlestick patterns to identify high-probability trade setups.
Always follow the trend and manage risk wisely!
Price Action Analysis Interprets Market Movements Using Patterns And Trends On Price Charts.
👉👉👉Follow us for Live Market Views/Trades/Analysis/News Updates.

DALBHARAT | Buy @LTP | SL below 1750 | Target 2400Disclaimer:
This is not financial advice. Please do your own research or consult with a financial advisor before making any investment decisions. Investments in stocks can be risky and may result in loss of capital.

Dalmia Bharat Ltd (NSE) – Swing Trade SetupThe stock **Dalmia Bharat Ltd (DALBHARAT)** is approaching a **strong multi-support zone**, making it a potential **swing trade opportunity** for bullish traders.
### **📊 Key Technical Analysis:**
✅ **Multiple Rejections at Support** – Price has tested the **1,715 - 1,708 zone** multiple times and bounced, indicating strong **buying interest**.
✅ **50-Day Moving Average Resistance** – If price reclaims above this level, a strong breakout rally could follow.
✅ **Bullish Reversal Pattern** – The price action shows **rejection wicks** at the lows (highlighted in red), signaling demand from buyers.
---
### **🎯 Trade Plan – Potential Upside Targets:**
🔹 **Entry Zone:** **1,715 - 1,708** (Near Support)
🔹 **First Target:** **1,850** (Psychological Level)
🔹 **Second Target:** **1,935 - 1,938** (Major Resistance Zone)
📌 **Stop-Loss Below:** **1,672** (Below Support Zone)
🔻 **Risk Management:**
⚠️ Avoid holding if price breaks **below 1,672**, as it could lead to further downside.
⚠️ Use a **risk-reward ratio of 1:2 or better** for optimal trade execution.

DALBHARAT - Amazing consolidation!!DALBHARAT has taken a support around ~1720 with a resistance around - 1930!
Will it break 1930 and fly? Keep an eye on this gem!!
DYOR before you invest.

DalbharathAll is well
Good day
Just my view and educational purposes only I'm not a SEBI registered advisory...trade on your own risk.
This is simple ORB Strategy with volume breakout..i will enter EOD 3.25pm if the price trade above the blue line and after entry I will wait for my target or stoploss (D candle should close below the red line) in valid if direct not triggered and closed below red line..
Just a view educational purposes only

DALBHARATNSE:DALBHARAT
Topping structure. Choppyness. Probability of range bound is more.
SHORT trade potential, given the market condition is weak.

DALBHARAT CMP 1828Loved the support..price is trying to move above all them moving averages plus there is spike in volume..interesting case! I'm keeping an eye to add it to my portfolio.
Do your research before you trade. This is for educational purpose.

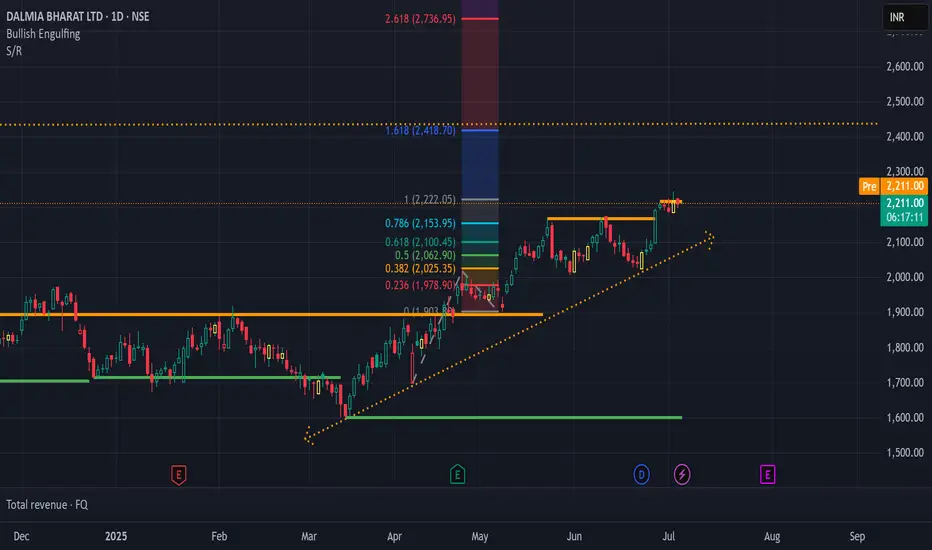
DALMIA BHARAT On weekly time frame price has corrected upto 0.5 fibb level,
we can make an entry on 15 min time frame.. with a 5% stoploss with a reward of 12-15%

DALBHARATDisclaimer:
This is not financial advice. Please do your own research or consult with a financial advisor before making any investment decisions. Investments in stocks can be risky and may result in loss of capital.

Dalmia Bharat Ready for a Bounce!
Current Market Price: 1975
Stop Loss: 1880
Targets: 2040, 2141
Extended Target: 2262 (if it crosses 2141)
Key Reasons:
Small contraction breakout above the Fibonacci 38% level.
Strong bounce from trendline support.
Continuous lower lows followed by a breakout of the lower high pattern, indicating potential for more upside.
📉 Risk Management: As the market is volatile, it's crucial to manage risk effectively with appropriate position sizing.
📊 Disclaimer: As a non-SEBI registered analyst, I recommend conducting thorough research or seeking advice from financial professionals before making investment decisions.
#DalmiaBharat #MarketAnalysis #TechnicalBreakout #RiskManagement #InvestmentOpportunities

POLE FLAG WITH ROUNDING BOTTOM IN DALMIA BHARATWe can See a trend change in Dalbharat...
Phase 1 Downside - Done
Phase 2 Sideways Consolidation - on going
Phase 3 Trend continuation or Reversal - NEXT
For Short term we can see Pole flag formation in Dalbharat after trendline break
For long term if the pole and flag gets activated we can see Cup and Handle next.
Dalbharat has been trading in range and consolidating...
Dotted Trendline should act as Upside support
Idea Invalid if 1840 broken on DCB


Planned Positional Long Trade in DALBHARAT
In the picture above we have drawn Trendlines to understand the direction of the Price. We see that Price has come down violating the Demand areas and respecting the Supply areas forming Lower Lows, hence was in a clear downtrend
Now most of the times before changing the trend price goes sideways
Here we see Price clearly going sideways. So we know there will be a change in Trend from Down to Sideways to UP Let's see how
An Uptrend has a Source from where the Trend starts and there is a point which we have called as a Destination of the Trend where it is trying to reach. So we have the Start point and End point of this upcoming Buy Trend.
Let's Understand the Demand and Supply Curve wrt to Price here
This tells us where is low, middle and high, course as traders we gotta buy low and sell high and avoid the middle area. This clearly tells us where is low and where is high.
After reacting to the Weekly Source Demand, in the Daily chart we see that Price has formed a Daily Demand which has violated its previous High which confirms Buying Momentum.
Now we have two possibilities for outcome of this Trade either it will take the SL or it will take the Target.
As a Trader we have to ensure our Reward to Risk ratio is favourable enough making the Risk practically worth taking.
Trade Type : Position Swing Trade
Entry : 1861.35
SL : 1794.25
Target : 2220.35
Reward : 359
Risk : 67.10
Ratio : 5.35/1

Dalmia Bharat Ltd. – Technical Analysis and Key Levels to WatchAs of today, Dalmia Bharat Ltd. is trading around ₹1,910.35. The stock has been consolidating in a defined range, with key levels providing important insights into potential future price movements.
Key Price Levels:
Immediate Resistance – ₹1,966 (5.02% above current price):
The stock faces its first significant resistance at ₹1,966. A breakout and sustained move above this level could signal a bullish trend continuation.
Next Resistance – ₹2,060.90:
If the stock manages to break ₹1,966 with strong momentum, the next upside target would be ₹2,060.90, representing the next key resistance zone.
Support Levels:
₹1,910:
This is the current level, which has been tested multiple times and is acting as immediate support.
₹1,847
: A stronger support zone, which has seen significant accumulation as indicated by volume profile analysis.
[
b]Technical Indicators:
Volume Profile
: There is notable accumulation around the ₹1,800-₹1,850 range, showing strong buying interest. The high volume in this area indicates it as a solid support zone.
Moving Averages:
The stock is trading close to key moving averages, including the 200-day moving average. A decisive breakout above these averages would reinforce the bullish outlook.
RSI (Relative Strength Index):
The RSI is currently neutral but trending upwards, suggesting the stock is gaining momentum without being in overbought territory.
Potential Scenarios:
Bullish Breakout:
A breakout above ₹1,966, especially with strong volume, could lead to a further rally toward ₹2,060.90 and beyond. This would confirm a bullish trend reversal.
Failure to Breakout:
If the stock fails to break above ₹1,966, we may see it retest the support zones at ₹1,910 or ₹1,847, leading to further consolidation.
Conclusion:
The ₹1,966 level is the immediate resistance to watch closely. A breakout above this level could unlock significant upside potential, with the next target being ₹2,060. However, failure to sustain above this could lead to consolidation in the range of ₹1,847-₹1,966. Traders and investors should monitor these levels for potential trading opportunities.


Dalmia bharat - swing longCement sector is looking good after a very long pause in the entire sector.
dalbharat is showing double bottom is a reversal sign and also forming cup and handle.

DALMIA BHARAT take support on Weekly Trendline...NSE:DALBHARAT trade at 1890 level. Stock take a strong support on Weekly Trendline, So you can watch for next resistance at 2400-2500 level.

Prominent Player from Sugar And Ethanol Blending industry.Current updates on Sugar Industry and ethanol blending progress from govt. of India may bring fresh run in all Sugar stocks.
Dalmia Bharat is prominent leader in Sugar industry.
Good Bounce from Support and have given breakout from downward trendline.
Breakout awaited from base formation. Once this breakout is confirmed, we can take an entry for target of 2400.
View is neglected once the support is breached.
Fresh buying after resistance is breached.
No Buy /Sell Reco, please do your analysis before taking trade.
Happy investing.
Stay Invested.

Dalmia Bharat : Rising Trending Stock for Swing PlayDalmia Bharat
Best buy level 1850
SL 1800 (Daily Closing Basis)
TGTs - Each previous Swing Highs (Lowe Highs)
Play all Fractals within these levels

Dalmia Bharat next week target 1860Dalmia Bharat could be a good stock for the next week which looks better as per technical analysis, the stock is up trending on the daily chart. The stock is trading 53% on the daily chart as per the RSI indicator, indicating the strength of the stock. This stock can prove to be a better option for buying next week.

Bharat Dalmia 1900 CE bought at ₹54 with a sl at 44Bharat Dalmia 1900 CE bought at ₹54, with a stop loss at ₹44 and a target of ₹90-₹120+.
