DCB BANK -fundamentally attractive and looking goodDCB Bank is fundamentally attractive value‑wise: strongly capitalized, efficient, and profitable, yet deeply undervalued. However, potential risks include credit quality and low free cash flows.
Stock has found support from medium-term moving averages.
DCBBANK trade ideas
DCBBank, 1DBreakout from Pattern is very Good ,
Can Enter if you u want to take Small Risk than Usual , then you can consider
Actually it is Bit late Entry or you can Avoid it if your risk is high
Follow for more Swing Ideas Like this

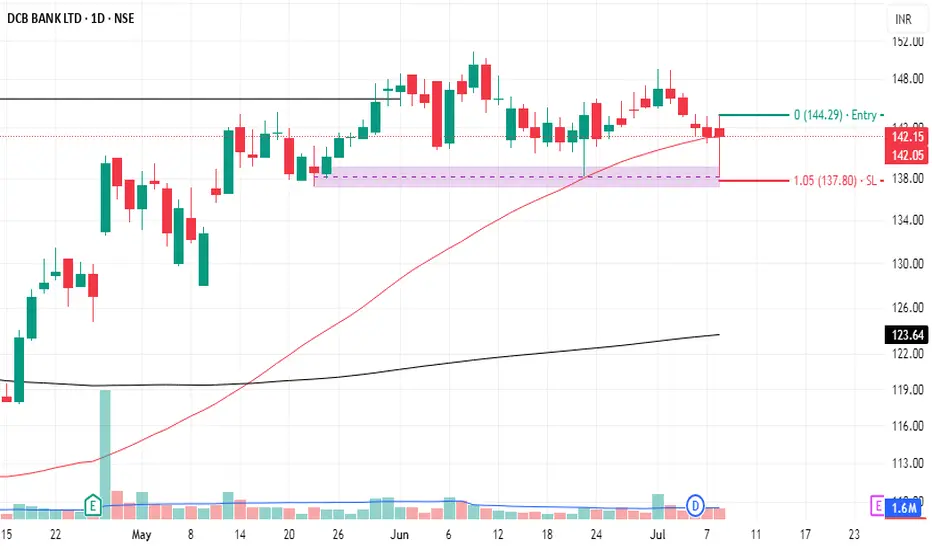
DCB Bank Ltd. - First Entry Initiated.Everything is pretty much explained in the picture itself.
I am Abhishek Srivastava | SEBI-Certified Research and Equity Derivative Analyst from Delhi with 4+ years of experience.
I focus on simplifying equity markets through technical analysis. On Trading View, I share easy-to-understand insights to help traders and investors make better decisions.
Kindly check my older shared stock results on my profile to make a firm decision to invest in this.
For any query kindly dm.
Thank you and invest wisely.

DCB Bank LongDCB (Nse)
MTF Analysis
DCBI Yearly Demand Breakut 126
DCBI 6 Month Demand DMIP 92.25
DCBI Qtrly Demand BUFL 119
DCBI Monthly Demand DMIP 131
DCBI Monthly Demand DMIP 117
DCBI Weekly DMIP 123.55
DCBI Daily Demand BUFL 1141
ENTRY 123.55
SL 115
RISK 8.55
Target 166.45
REWARD POINT 42.9
Last High 145
RR 5.02
RR 35%

DCBBANK NSE:DCBBANK
Trading in Range
Can buy at lower level of Channel.
Sl- 112 on Closing basis.
Support 120
Target - 135/144/160(after channel breakout)
RSI>40


DCB bank long trade financial results are excellent. all numbers are at all time high. revenue , profit and the likes. Nice reverse head and shoulder at a key pivot level has formed. bank valuation set for a rerating. Technicals matching fundamentals nicely. Bet the house on it. without a stop loss bcos only bitches keep stoplosses

DCB Bank - heading towards 260 - positive signs all overDCB Bank has given positive signal on our proprietary fundamental + technical indicator.
It could double from current levels of 130-135 to 260-270 within 12 months.

DcbbankStock name = Dcb Bank Limited.
Weekly chart setup
Chart is self explanatory. Levels of breakout, possible up-moves (where stock may find resistances) and support (close below which, setup will be invalidated) are clearly defined.
Disclaimer: This is for demonstration and educational purpose only. this is not buying and selling recommendations. I am not SEBI registered. please consult your financial advisor before taking any trade.

💥DCB Bank💥-Nice Breakout💥DCB Bank💥-Nice Breakout
Capital to be deployed- 20k
Investing Price-155-157
Breakout Price-155
Stoploss-111
Targets-188-263
RT for max reach
#dcbbank #stockstowatch #StocksToBuy #StocksInFocus #stocks #StockMarket

DCB bank is back in uptrendwe can expect 129 to 140 levels from cmp
stop loss is 111.5 on day close basis

DCB BANK LTD SWING TRADE IDEADCB BANK LTD closed above weekly resistance zone as well as 52 weeks high with a gud volume bar after trapping sellers can play for swing trade with your prefered RR.

Target 200+If stock shows breakout above resistance channel. It shall give minimum 200 on upside. Time horizon 1 year.

DCBBANK Stock take support in previous support line and 200 DEMA dynamic support also is 113.
Bullish engulfing in downtrend chart bottom.
Good risk reward for long position.
'Paper trade' Buy above today high price cross and S.L Today Day Low
Target 128-130.
Disclaimer this is my personal view for education purpose only.
No buy sell recommendations.


DCB BANK LTDThis stock has been formed like rounding bottom chart pattern and done breakout with good intensity of volume in weekly chart, along with many more positive signs aligned with same bias in Macd, Rsi, Dmi adx, Bollinger band etc. This whole scenario is suggesting that this stock could be an investment pick, all the key levels are mentioned in chart with Stop-loss and Targets.
Breakout with good intensity of volume in daily
Breakout with good intensity of volume in weekly
Dmi adx also positive
RK momentum positive
Macd in daily positive crossover and Uptick and also above zero
Macd in weekly positive crossover and Uptick and also above zero line
Rsi in daily above 60 uptick
Rsi in weekly uptick and above 60
Weekly BBC along with trendline breakout
Daily BBC
Most traders treat trading as a hobby because they have a full-time job doing something else. However, If you treat trading like a business, it will pay you like a business. If you treat like a hobby, hobbies don't pay, they cost you....!
Disclaimer
I am not sebi registered analyst
My studies are for Educational purpose only
Please consult your Financial advisor before trading or investing
I am not responsible for any kind of profit or loss


DCB levels...20.01.2022 (D Candle)DCB waiting for breaks trendline and also forming bullish hormonic pattern ,so will expect 100+ in short term


DCBBANK - Bullish Wolfewave - A great RR setupDCBBANK in progress of forming wolfewave at weekly timeframe. waiting for price to hit demand zone . a great RR trade for positional traders...


