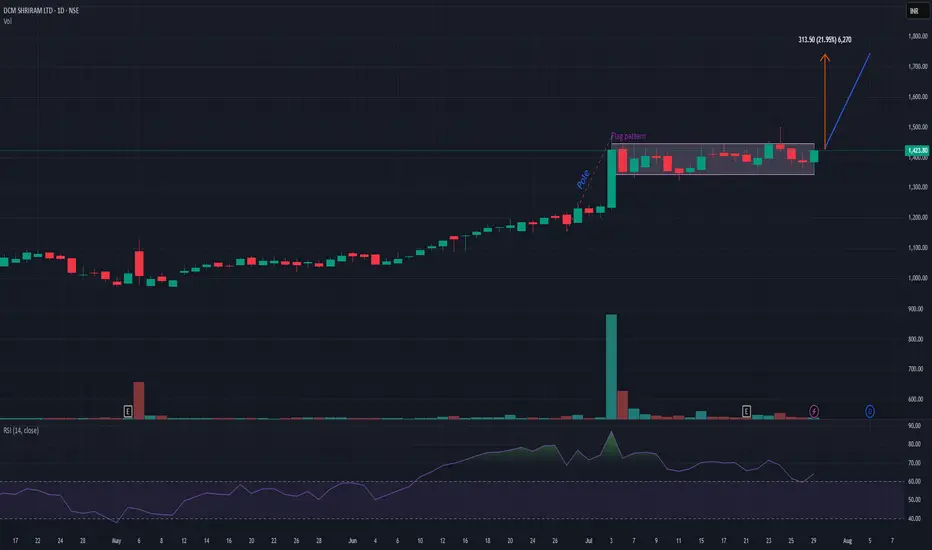
DCMSHRIRAMDCMSHRIRAM is on verge of flag pattern breakout provided that it closes above 1440 level. It has a potential to add up to 20-22% from this level. My view may change if it closes below 1350. Risk-reward is quite in favor. Keep it on radar.
39.60 INR
6.04 B INR
120.42 B INR
37.21 M
About DCM SHRIRAM LTD
Sector
Industry
Website
Headquarters
New Delhi
Founded
1889
ISIN
INE499A01024
FIGI
BBG000CQCML3
DCM Shriram Ltd. engages in the business of agri-rural, value added, and chlor-vinyl. It operates through the following segments: Fertilizers, Chloro-Vinyl, Shriram Farm Solutions, Sugar, Bioseed, and Others. The Fertilizers segment involves in manufacturing of urea. The Chloro-Vinyl segment produces poly-vinyl chloride, carbide, and chloralkali products. The Shriram Farm Solutions segment engages in trading of super phosphate, other fertilizers, seeds, and pesticides. The Sugar segment consists of sugar products, co-generation of power, and distillery. The Bioseed segment offers hybrid seeds. The Others segment comprises of unplasticized polyvinyl chloride window systems, cement, rural retail, and plaster of Paris. The company was founded by Shriram in 1889 and is headquartered in New Delhi, India.
Related stocks
Amazing breakout on WEEKLY Timeframe - DCMSHRIRAMCheckout an amazing breakout happened in the stock in Weekly timeframe, macroscopically seen in Daily timeframe. Having a great favor that the stock might be bullish expecting a staggering returns of minimum 25% TGT. IMPORTANT BREAKOUT LEVELS ARE ALWAYS RESPECTED!
NOTE for learners: Place the break
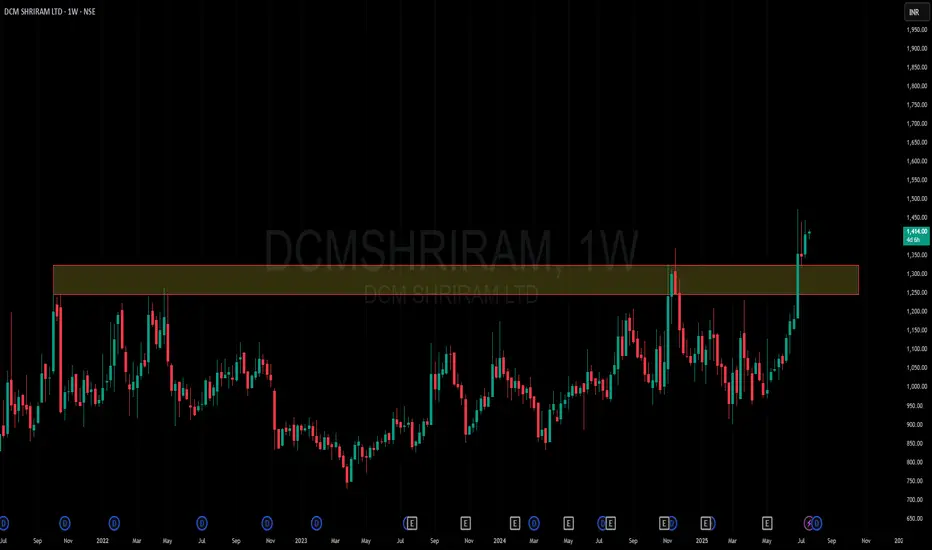
DCM shriramAfter 4 years cobsolidation with huge volume breakout
This is only for study purpose not any buy or sell.
DCM Shriram Ltd view for Intraday 8th May #DCMSHRIRAM DCM Shriram Ltd view for Intraday 8th May #DCMSHRIRAM
Resistance 1020-1025 Watching above 1027 for upside movement...
Support area 1000 Below 1010 ignoring upside momentum for intraday
Watching below 995 for downside movement...
Above 1010 ignoring downside move for intraday
Charts for Education

DCM Shriram Ltd view for Intraday 6th May #DCMSHRIRAM DCM Shriram Ltd view for Intraday 6th May #DCMSHRIRAM
Resistance 1020-1025 Watching above 1027 for upside movement...
Support area 1000 Below 1010 ignoring upside momentum for intraday
Watching below 998 for downside movement...
Above 1010 ignoring downside move for intraday
Charts for Education

DCM shriram : watchlist candidate Breakout required for confirmation
.
DCM Shriram is engaged in the business of manufacturing facilities of Fertiliser, Chloro Vinyl & Cement in Kota (Rajasthan) and of Chlor- Alkali in Bharuch (Gujrat).

Necklace Pattern- DCMShriramIs this getting ready for some move?
DCM Shriram
Can this rally, take it up?
DCM Shriram is all set, isnt it?

momentum comingfib Tracing breakout level . it will give expected targets with in 1 month
Holding Period 1 month
Entry level 1186
wait for entry level

DCMSHRIRAM | If closing above 1130Disclaimer:
This is not financial advice. Please do your own research or consult with a financial advisor before making any investment decisions. Investments in stocks can be risky and may result in loss of capital.

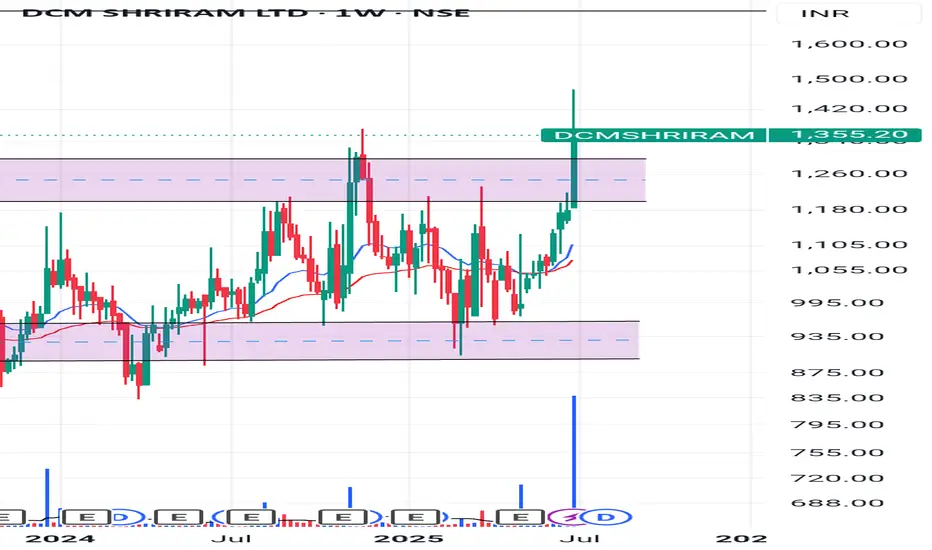
Multiyear Breakout Re-TestAfter Multiyear Consolidations breakout price finally retest its breakout level and as per price action previous resistance now act as a support .

See all ideas
Summarizing what the indicators are suggesting.
Neutral
SellBuy
Strong sellStrong buy
Strong sellSellNeutralBuyStrong buy
Neutral
SellBuy
Strong sellStrong buy
Strong sellSellNeutralBuyStrong buy
Neutral
SellBuy
Strong sellStrong buy
Strong sellSellNeutralBuyStrong buy
An aggregate view of professional's ratings.
Neutral
SellBuy
Strong sellStrong buy
Strong sellSellNeutralBuyStrong buy
Neutral
SellBuy
Strong sellStrong buy
Strong sellSellNeutralBuyStrong buy
Neutral
SellBuy
Strong sellStrong buy
Strong sellSellNeutralBuyStrong buy
Displays a symbol's price movements over previous years to identify recurring trends.
Frequently Asked Questions
The current price of DCMSHRIRAM is 1,374.30 INR — it has decreased by −3.87% in the past 24 hours. Watch DCM SHRIRAM LTD stock price performance more closely on the chart.
Depending on the exchange, the stock ticker may vary. For instance, on NSE exchange DCM SHRIRAM LTD stocks are traded under the ticker DCMSHRIRAM.
DCMSHRIRAM stock has fallen by −3.90% compared to the previous week, the month change is a 12.80% rise, over the last year DCM SHRIRAM LTD has showed a 29.29% increase.
We've gathered analysts' opinions on DCM SHRIRAM LTD future price: according to them, DCMSHRIRAM price has a max estimate of 1,230.00 INR and a min estimate of 1,230.00 INR. Watch DCMSHRIRAM chart and read a more detailed DCM SHRIRAM LTD stock forecast: see what analysts think of DCM SHRIRAM LTD and suggest that you do with its stocks.
DCMSHRIRAM reached its all-time high on Jul 24, 2025 with the price of 1,502.30 INR, and its all-time low was 73.55 INR and was reached on Mar 13, 2014. View more price dynamics on DCMSHRIRAM chart.
See other stocks reaching their highest and lowest prices.
See other stocks reaching their highest and lowest prices.
DCMSHRIRAM stock is 5.31% volatile and has beta coefficient of 0.47. Track DCM SHRIRAM LTD stock price on the chart and check out the list of the most volatile stocks — is DCM SHRIRAM LTD there?
Today DCM SHRIRAM LTD has the market capitalization of 214.66 B, it has increased by 3.99% over the last week.
Yes, you can track DCM SHRIRAM LTD financials in yearly and quarterly reports right on TradingView.
DCMSHRIRAM net income for the last quarter is 1.13 B INR, while the quarter before that showed 1.79 B INR of net income which accounts for −36.63% change. Track more DCM SHRIRAM LTD financial stats to get the full picture.
DCM SHRIRAM LTD dividend yield was 0.84% in 2024, and payout ratio reached 23.23%. The year before the numbers were 0.77% and 23.02% correspondingly. See high-dividend stocks and find more opportunities for your portfolio.
As of Aug 2, 2025, the company has 15.45 K employees. See our rating of the largest employees — is DCM SHRIRAM LTD on this list?
EBITDA measures a company's operating performance, its growth signifies an improvement in the efficiency of a company. DCM SHRIRAM LTD EBITDA is 13.86 B INR, and current EBITDA margin is 11.11%. See more stats in DCM SHRIRAM LTD financial statements.
Like other stocks, DCMSHRIRAM shares are traded on stock exchanges, e.g. Nasdaq, Nyse, Euronext, and the easiest way to buy them is through an online stock broker. To do this, you need to open an account and follow a broker's procedures, then start trading. You can trade DCM SHRIRAM LTD stock right from TradingView charts — choose your broker and connect to your account.
Investing in stocks requires a comprehensive research: you should carefully study all the available data, e.g. company's financials, related news, and its technical analysis. So DCM SHRIRAM LTD technincal analysis shows the neutral today, and its 1 week rating is buy. Since market conditions are prone to changes, it's worth looking a bit further into the future — according to the 1 month rating DCM SHRIRAM LTD stock shows the buy signal. See more of DCM SHRIRAM LTD technicals for a more comprehensive analysis.
If you're still not sure, try looking for inspiration in our curated watchlists.
If you're still not sure, try looking for inspiration in our curated watchlists.