DEEPAKNTRDEEPAKNTR
watch above levels. green line is our entry, redline is our SL.
DISCLAIMER : I am NOT a SEBI registered advisor or a financial adviser. All the views are for educational purpose only.
DEEPAKNTR trade ideas

DEEPAK NITRITE - BUYNSE:DEEPAKNTR Weekly location with rounding bottom may be occur in near future , stock also consolidate near 4 year moving averages.

Chemical Sector Stock Deepak Nitrite Trading Around SupportDeepak Nitrite Ltd Stock trading around support, Followings are the observations:
Multiple Parallel Channels
Opening Wedge or Gramophone Pattern
Diamond Pattern

Deepak Nitrite (DEEPAKNTR)I'm not a SEBI REGISTERED ANYLISIS
just for learning purpose
above the blue line close in D chart candle i will buy and put strictly SL to below red line...once candle close below Red line in D chart...i will close the Trade...
target check the chart
educational purpose only
oits simple ORB WITH VOLUME BREAKOUT STRATEGY...with small condition apply for selecting the stocks
owt not response for your profit and loss

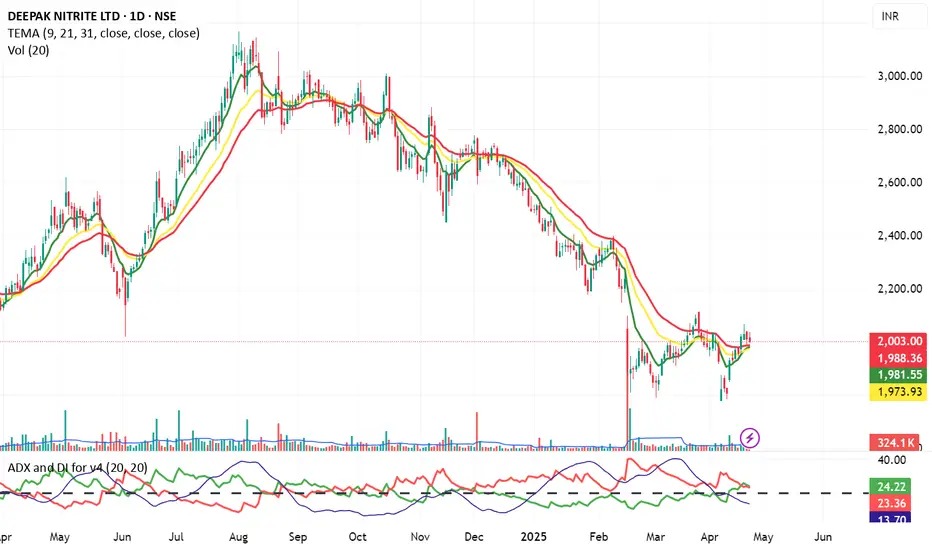
DEEPAKNTR NSE:DEEPAKNTR
🚨 Buy Entry Suggestion:
Wait for confirmation: A daily close above ₹2,150 (previous resistance) with continued volume and strong crossover on EMAs.
Conservative traders may wait for the price to sustain above the 31 EMA (currently ₹1,973.93).
📌 Summary:
✅ Early Buy Zone: Between ₹1,975–2,030 (if confirmed with volume and crossover).
✅ Strong Confirmation Buy Zone: Above ₹2,150.
❌ Avoid buying if price breaks below ₹1,950 again — would indicate false breakout.
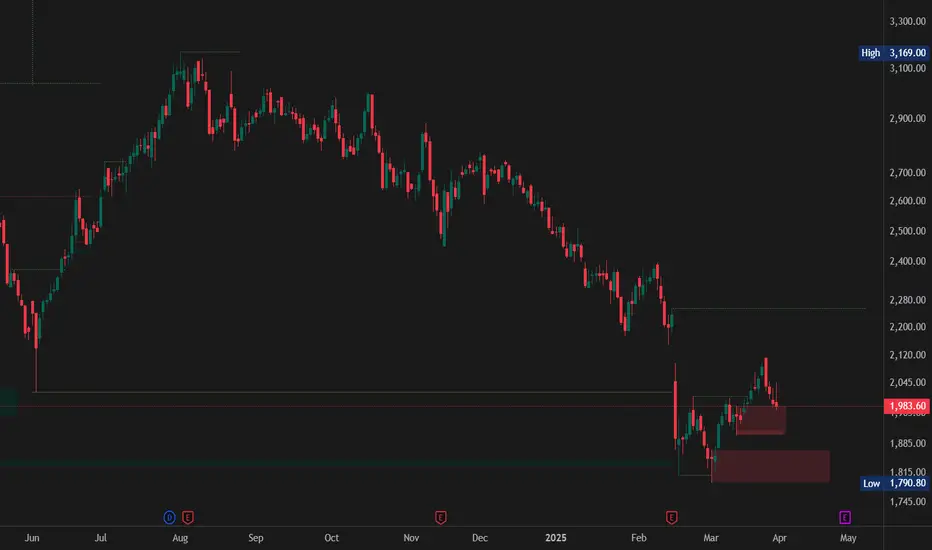
"Deepak Nitrite – The Perfect Investment Opportunity?"Description:
✅ Deepak Nitrite is currently at a critical accumulation zone, making this a great time for long-term investors!
📊 Key Market Structure:
All-Time High: ₹3,469 (Aug 2024)
Recent Low: ₹1,790 (Down ~45% from ATH)
Current Price: ₹1,983
Monthly Swing Low Taken (2021 Levels)
Consolidation Phase (Oct 2021 – April 2025) indicates a potential big move ahead.
📌 Investment Strategy:
🔹 Best Entry Zones:
₹1,921 – ₹1,907 (Partial Accumulation)
₹1,871 – ₹1,790 (Ideal Long-Term Buying Zone)
Stop Loss: Recent low for risk management.
🎯 Target Projections:
✅ Target 1: ₹2,257
✅ Target 2: ₹2,399
✅ Target 3: ₹2,800
✅ Target 4: ₹4,800+++ 🚀
💡 Why Now?
Multi-year consolidation indicates a strong breakout potential.
Current levels offer a favorable risk-reward ratio for long-term investors.
If price enters our target zones, it presents a rare wealth-building opportunity.
⚠️ Risk Management: Always invest based on your risk appetite and analysis.
📢 Don’t Miss Out!
✅ Follow me for more in-depth stock analysis.
👍 Drop a like & leave a comment with your thoughts!
💬 Let’s discuss in the comments – See you there! 🚀📊
SWING IDEA - DEEPAK NITRITE LTDDeepak Nitrite , a leading chemical company known for its diverse product portfolio, is showing a promising setup for swing trading.
Reasons are listed below :
2500 Support Zone : The price is resting on a well-tested support level around 2500, adding to the reliability of a potential bounce.
Hammer Candle on Weekly Timeframe : The appearance of a hammer candle suggests a reversal could be on the horizon as buyers regain control.
Golden Fibonacci Support : The current price aligns with a key Fibonacci retracement level, providing additional support.
50 EMA Support on Weekly Timeframe : The price holding above the 50 EMA is a sign of continued strength and underlying support.
Trend Intact with Higher Highs and Higher Lows : The consistent formation of higher highs and higher lows reinforces a bullish trend.
Target - 3000 // 3170
Stoploss - weekly close below 2440
DISCLAIMER -
Decisions to buy, sell, hold or trade in securities, commodities and other investments involve risk and are best made based on the advice of qualified financial professionals. Any trading in securities or other investments involves a risk of substantial losses. The practice of "Day Trading" involves particularly high risks and can cause you to lose substantial sums of money. Before undertaking any trading program, you should consult a qualified financial professional. Please consider carefully whether such trading is suitable for you in light of your financial condition and ability to bear financial risks. Under no circumstances shall we be liable for any loss or damage you or anyone else incurs as a result of any trading or investment activity that you or anyone else engages in based on any information or material you receive through TradingView or our services.
@visionary.growth.insights

DEEPAKNTR looks good for investmentStock looks good for investment for the period of 6-12 months. There are multiple targets with Stoploss of ~100 points. Expecting it go higher as it is in the fertilizer sector so inflation won't harm it that much compare to other sectors.

Flag Pattern* 4 Year Consolidation touched on Support multiple times trend line Year Jun-20 TO Jun-24.
* 4 Year Consolidation touched on resistance multiple times trend line Year Oct-21 TO April-24.
* Expected To reach at the next level. Price level - 20k.

Deepak Nitrite Ltd's (DEEPAKN) technical analysisDeepak Nitrite Ltd's (DEEPAKN) technical analysis shows daily price movements. Here's a summary of the key insights:
Price Action and Trend:
The stock price is consolidating within a triangular pattern, suggesting a possible breakout or breakdown in the future.
A strong support level is evident near ₹2,454.60.
Resistance is marked at multiple levels, with a highlighted "Strong Resistance Zone" around ₹3,023 to ₹3,150.
Fibonacci Levels:
Fibonacci retracement levels are drawn from a previous significant swing low to high:
0.5 Level: ₹3,023.50 (a key resistance level).
0.618 Level: ₹3,157.75 (another potential resistance zone).
Targets:
Target 1: ₹3,150.95 (based on Fibonacci 0.618 level).
Target 2: ₹3,594.70 (prior high or 1 Fibonacci level).
Target 3: ₹4,271.95 (extension at 1.618 Fibonacci level).
Strong Resistance Zone:
The shaded region indicates a historically strong resistance zone, where the price has struggled to break above in the past.
Outlook:
If the price breaks above the resistance zone, it could aim for Target 1 and potentially higher targets.
A breakdown below the triangle's lower trendline or ₹2,454.60 could lead to a bearish scenario.

Deepak Nitrite Buy Price ActionAs per my analysis NSE:DEEPAKNTR has been done a proper correction and sustained above major support of 2622. It could be better risk taken area for buy. A small retracement is pending up to 2570 and this is the best buy level with stop loss of 2453. My expected upside target will be 2726 and 2811.
Note: This is my personal analysis to learn stock market behavior. Kindly do your own analysis or consult your financial advisor to take any risk.
Thanks & Regards.

DEEPAK NITRITE LTD S/RSupport and Resistance Levels:
Support Levels: These are price points (green line/shade) where a downward trend may be halted due to a concentration of buying interest. Imagine them as a safety net where buyers step in, preventing further decline.
Resistance Levels: Conversely, resistance levels (red line/shade) are where upward trends might stall due to increased selling interest. They act like a ceiling where sellers come in to push prices down.
Breakouts:
Bullish Breakout: When the price moves above resistance, it often indicates strong buying interest and the potential for a continued uptrend. Traders may view this as a signal to buy or hold.
Bearish Breakout: When the price falls below support, it can signal strong selling interest and the potential for a continued downtrend. Traders might see this as a cue to sell or avoid buying.
20 EMA (Exponential Moving Average):
Above 20 EMA(50 EMA): If the stock price is above the 20 EMA, it suggests a potential uptrend or bullish momentum.
Below 20 EMA: If the stock price is below the 20 EMA, it indicates a potential downtrend or bearish momentum.
Trendline: A trendline is a straight line drawn on a chart to represent the general direction of a data point set.
Uptrend Line: Drawn by connecting the lows in an upward trend. Indicates that the price is moving higher over time. Acts as a support level, where prices tend to bounce upward.
Downtrend Line: Drawn by connecting the highs in a downward trend. Indicates that the price is moving lower over time. It acts as a resistance level, where prices tend to drop.
RSI: RSI readings greater than the 70 level are overbought territory, and RSI readings lower than the 30 level are considered oversold territory.
Combining RSI with Support and Resistance:
Support Level: This is a price level where a stock tends to find buying interest, preventing it from falling further. If RSI is showing an oversold condition (below 30) and the price is near or at a strong support level, it could be a good buy signal.
Resistance Level: This is a price level where a stock tends to find selling interest, preventing it from rising further. If RSI is showing an overbought condition (above 70) and the price is near or at a strong resistance level, it could be a signal to sell or short the asset.
Disclaimer:
I am not a SEBI registered. The information provided here is for learning purposes only and should not be interpreted as financial advice. Consider the broader market context and consult with a qualified financial advisor before making investment decisions.

Deepak Nitrite taking support at trendlineDeepak Nitrite taking support at trendline line and marching upwards

Understanding the Flag Pattern - DEEPAKNTR
A flag pattern is a continuation pattern that indicates a brief consolidation before the previous trend resumes. It's characterized by a strong price move, followed by a period of consolidation, and then a breakout in the same direction as the initial move.
Characteristics of a Flag Pattern:
Flagpole: This is the initial strong price movement that forms the pole of the flag. It often occurs with high volume.
Flag: The consolidation phase that resembles a rectangle or a parallelogram, usually sloping counter to the initial trend.
Breakout: The resumption of the trend, breaking out from the consolidation phase in the same direction as the flagpole.
Flag Pattern in DEEPAK NITRITE LTD Chart
In the DEEPAK NITRITE LTD chart:
Flagpole: The initial strong upward movement (represented by the orange ascending trend line) is the flagpole.
Flag: The recent price channel (highlighted by the parallel blue lines) represents the flag, indicating a consolidation phase.
Breakout Potential: Given the high volume during the upward moves and lower volume during pullbacks, a breakout above the flag's upper boundary could signal the continuation of the upward trend.
Conclusion
Flag patterns are powerful indicators of trend continuations. In the case of DEEPAK NITRITE LTD, the identified flag pattern suggests that the stock may continue its upward movement after this period of consolidation. Keep an eye on the breakout above the flag's upper boundary for potential trading opportunities.
Happy trading! 🚀📈 If you need further insights, feel free to follow me! 😊

Deepak Nitrite chart analysisDeepak Nitrite chart analysis on daily time frame. This looks like a triangle pattern.
Please share your feedback and help me grow.
Please follow for more such charts.

Deepak Nitrite Stock Chart
Ascending Channel: The stock has been trading within an upward-sloping channel since late 2023, making higher highs and higher lows, which indicates a strong long-term uptrend. The price recently tested the lower boundary of the channel and has shown signs of a rebound.
Triangle Breakout: A bullish breakout has occurred from a symmetrical triangle pattern, suggesting renewed upward momentum. The stock has surged by over 20.26% from the breakout point, confirming the pattern. The breakout targets are around ₹3,562 based on the height of the triangle projected from the breakout.
MACD: The MACD indicator shows a bullish crossover, with the MACD line crossing above the signal line, which is a strong confirmation of positive momentum.
Key Support Levels:
₹2,800: This level aligns with the lower boundary of the channel and has acted as strong support.
₹2,600: A previous low that provides additional support in case of any pullback.
Resistance Levels:
₹3,095: A key resistance level to watch, previously tested and failed.
₹3,562: The price target projected from the breakout.
Volume: Volume has been rising since the breakout, further validating the upward move and adding confidence to the bullish outlook.
Conclusion:
With the recent breakout and strong upward momentum, Deepak Nitrite shows a bullish trend. Investors should watch for a retest of support levels near ₹2,800, while upside targets point to ₹3,562. The long-term trend remains positive as long as the stock holds within the ascending channel.

Life of Trader'sAfter Assistant Part Time Trader (Bhupen A My system) unsuccessfully attempts suicide, he recounts his story of the Trader, India, underworld, which he'd been investigating for decades. It begins with the tale of System (Display), a smuggler. Bhupen A to take System down through the gang leader's relationship with a Hardware Toolkit, but his attempt fails. Then a rising gangster, the power struggle is far from over and Bhupen A(Trader) cut his system head..

Great setup in deepak nitrateTechnically strong
Stock is good and if market sustains this will surely be good trade
If sustains above the red line on weekly closing can be considered for long
Targets and stop on chart

Short Term Weekly Positional Trading in Deepak Nitrite Stock price is above MA
Above RSI
On daily time frame
Buy @ 2911
Stop loss - 2810
Target - 3000

DEEPAK NITRATE given range breakoutDEEPAK NITRATE has given range breakout and might hit 2700-3000.. good stock. Do watch

Deepak Nitrate Next Week Down side Target 2720Deepak Nitrate may see a decline of 2 to 3 per cent next week, with the stock seeing a big drop in the last two sessions. This decline can also be seen in the next week. The stock looks weak on the daily chart. Lamp nitrate can see targets up to 2720 on the downside.


Deepak Nitrite: 18 months of sadness 😞This Analysis was requested by @anerishah269
The chart should tell you everything you need to know about NSE:DEEPAKNTR :
However, Below are some 'good to know' pointers:
- The Price action is completely sideways in nature with clearly marked support and resistance zones
- The price has been consolidating for over 18 months now
- Owing to the sideways nature, the breakout of the trendline did not have a huge impact on the price momentum. The price immediately took a rejection from the resistance zone and gunned for a retest.
- Bearish crossover of MACD on a weekly TF is a negative
- The PE ratio has worsened
- The Psy. levels of 2000 and 2500 are at play
- We can expect some good momentum once either of the zones is broken. Until then, it's hold the fight and sit tight situation for us.
What should we analyze next?
Have Requests, Questions, or Suggestions? DM us or comment below.👇
⚠️Disclaimer: We are not registered advisors. The views expressed here are merely personal opinions. Irrespective of the language used, Nothing mentioned here should be considered as advice or recommendation. Please consult with your financial advisors before making any investment decisions. Like everybody else, we too can be wrong at times ✌🏻
