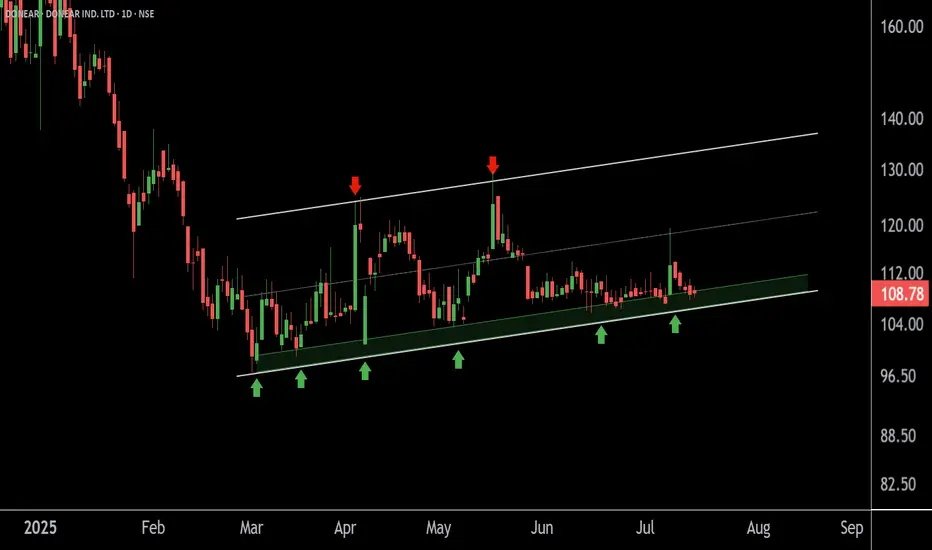
DONEAR at Best Support Zone !!This is the daily chart of Donear Industries.
Donear is moving in well defined parallel channel having a good support zone near 105 level.
if this level is sustain , then we may see higher prices in Donear .
Thank You !!
DONEAR trade ideas
DONEAR AT SUPPORT ZONE.This is the Weekly chart of DONEAR.
Donear is currently trading near its support zone in the ₹95–₹100 range.
The stock is trading within a larger pattern structure (broadening pattern) and is currently moving inside a smaller formation—an ascending channel (in DAILY timeframe) support at 103-105 range.
if this level is sustain ,then we may see higher price on ascending channel resistance at 130-135 range and long term resistance of the broadening pattern .........
Thank you !!!!

Donear's Bullish Reversal:Ride the Upswing!Donear's chart is painting a bullish picture!
KEY OBSERVATIONS:
*Weekl Demand Area Rejection: Donear has bounced off its weekly demand area,confirming buying pressure.
*Higher highs and Higher Lows (HH/HL): Lower time frame shows an uptrend.
*Bullish Divergence:RSI and Price action indicate strength.
OUTLOOK:
Expect Donear to surge above ,if it forms potential HL from the marked zone(123-115),with bullish candlestick.It could make another All-Time High if the weekly demand area holds strong.

Key Support / Resistance Breakout - Swing TradeDisclaimer: I am not a Sebi registered adviser.
This Idea is publish purely for educational purpose only before investing in any stocks please take advise from your financial adviser.
Key Support & Resistance Breakout. Stock has give Breakout of Resistance level. Keep in watch list. Buy above the high. Suitable for Swing Trade. Stop loss & Target Shown on Chart.
Be Discipline because discipline is the Key to Success in the STOCK Market.
Trade What you see not what you Think.
Penny Stocks are easy to manipulate please check the fundamentals of Company before Investing

ATH breakoutBreakout of rising wedge with successful retest and with good volume buildup.
ATH breakout with good volume.
Fundamental's are OK.
First time FII & DII stakes taken.
NOTE: I do my analysis, do yours before trade.


Donear Industries- Nice BreakoutDonear Industries- Nice Breakout
Capital to be deployed- 20k
Investing Price -124-129
Breakout Price -124
Stoploss -98
Targets -159-172-205
#donear #StockMarketindia #StockToWatch #StocksInFocus #stockstowatch #StocksToTrade

#DonearTechnical breakout stock. Decisive upward movement past a key resistance level, accompanied by increased trading volume.
This breakout suggests a shift in market sentiment and potential for further gains. Investors view breakouts as bullish signals, though caution is advised to avoid false breakouts. Proper risk management is essential to capitalize on these opportunities.

Donear IndustriesThe counter is out from multi week consolidation.
Buy on dips till 121
TGT 160 - 240 (30-100%)

doneardonear is getting ready for big move, the accumulation can stretch up to next year, however one can buy at 100 and sell 120, in short term, above 121 good for 159,225

DONEAR is SO-NEAR to 112Clear double bottom pattern seen. Selling volume has been falling off with todays daily showing good promises.
Disclaimer: These views are just for study and is not a buy and sell recommendation. NSE:DONEAR NSE:DONEAR


DONEAR looks good. Breakout with volumeCMP 116.15 | Good volume | Bullish momentum
*Not recommendation. Please do your du diligence

DONEAR BREAKOUT DONEAR has given a beautiful breakout on D TF also on W TF Breakout will be done if it gives good closing tomorrow.
keep an eye.


DONEAR - Cup & handle patternCMP 81.70 | Bullish momentum | Good volume
- May re-test between 71-80 levels
- Tracking for short to mid term
*Not recommendation


