EASY TRIP PLANNERS LTD Chart (Elliott Wave Perspective)Overall Trend:
The stock has been in a prolonged downtrend since reaching its peak.
The price structure suggests it is in a corrective phase based on Elliott Wave Theory.
Wave Count Analysis:
The chart shows a five-wave impulse, followed by a ZIG ZAG 5-3-5 corrective structure.
The C wave is currently unfolding and appears to be in its final stages.
Projected Price Movement:
The price is expected to form a wave (iv) retracement before continuing lower to complete the final (v) wave of C.
The projected target for wave (v) of C is in the ₹9 - ₹7.50 range.
There is a potential invalidation level at ₹20.46, meaning if price breaks above this, the bearish count might be reconsidered.
Key Levels to Watch:
Support Zone: ₹9 - ₹7.50 (Potential bottom for wave C)
Invalidation Level: ₹20.46 (Break above may suggest a reversal)
Bearish & Bullish Possibilities:
Bearish Case : If the stock follows the Elliott Wave count, it could complete its correction towards the ₹9 zone before any significant recovery.
Bullish Case: If the price moves above the ₹20.46 invalidation level, a potential trend reversal could be in play.
🚨 Disclaimer: The content shared is for educational and informational purposes only and should not be considered financial advice, investment recommendations, or trading signals. I am not a SEBI-registered analyst or advisor. Always conduct your own research and analysis before making any financial decisions. Trading and investing involve significant risk, and past performance is not indicative of future results. I may be completely wrong in my analysis. Please consult a professional financial advisor before making any investment decisions.
EASEMYTRIP trade ideas

EASYMYTRIP BUY Investment Update
Recommendation: Buy the script as it presents a favorable opportunity for upside potential.
Upside Potential: Expecting a 16–20% rise within the next 1–2 months.
Target Levels:
Initial Target: ₹18
Secondary Target: ₹21
Stop-Loss (SL): Place a stop-loss at ₹15 to manage risk effectively.
Rationale: Despite its recent underperformance, the script belongs to a fundamentally strong company and is poised for a rebound.

ease my trip - can have easy move ahead .. A probable path of Ease my trip is shown.
A curve formation ..can have fake breakout and then move upwards !

EASY TRIP PLANNERS LTD, Where lies the bottom?Further fall of 20% is expected, which will drive the price towards 27 level to complete wave Y.
Sometime it takes longer than usual to reach the target.
Do check the old trend analysis of Easy Trip Planners linked below.
This is not a buy or sell recommendation.
Do your own due diligence before taking any action.
Peace!!

Easy Trip Planners Ltd Easy Trip Planners Ltd, Price currently consolidating between range, Take a long entry with proper risk management as depicted on charts.

EASEMYTRIP - Is it a good time to buy this stock?If price re-test 43.50 , then it has potential up move of 20%.

EASY TRIP DAILY LEVELS 31.07.2024 EASY TRIP stock breakout the trend line corssing fibanocci levels ,so we expect up movemnet in this script and will expect 45-47 next levels...Do your rearch before investing

Easy Trip Planners Ltd -₹ 42.3-Stock looking good for swing trade 10-15% upside possible .
-Stock P/E 49 which is less than IP .
-Company is almost debt free.
-Company is expected to give good quarter.

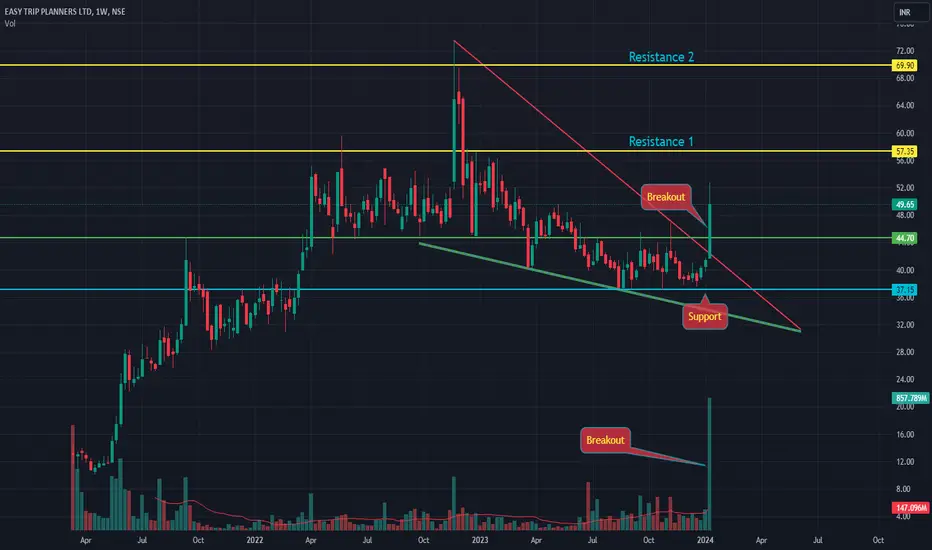
EaseMyTrip : Difficult Trip ahead?- EMT has been one of our star investments right from its IPO in March 2021.
- After giving 400% returns, It seems to have settled down in a comfortable range for almost 16 months now
- Yes, It is in the news for acquiring new companies and opening franchise stores. But, the latest news of the promoter selling his stake was a weak hand move. The holding went from 75% to 71% approx.
- Once a company has rallied so much, It becomes important to justify the pricing i.e. through a good EPS. The company struggles here as the PE stands at about 50. At its All time high, it was as high as 90.
- Also, the stock is trading at 18.2 times its book value.
- Technically, It has been consolidating. Lately, It broke the consolidation on the downside and is now testing the support ultimatum for the third time in the last 4 months. The resistance trendline too is a strong acting resistance.
- A break of the support ultimatum may open doors for a downward momentum.
What you do think will happen?
Have Insights or Questions? Let us know in the comments below.👇
While you do that, how about a boost for some motivation🚀
⚠️Disclaimer: We are not registered advisors. The views expressed here are merely personal opinions. Irrespective of the language used, Nothing mentioned here should be considered as advice or recommendation. Please consult with your financial advisors before making any investment decisions. Like everybody else, we too can be wrong at times ✌🏻

Long Idea on Easy TripPrice is at support. Taking rejection again and again. Monthly is also bullish as price is testing brk after breaking it. I have entered but next week order collection green candle is required. Else close if red candle closes below current candle

EASEMYTRIP about to explode "Market Cap": "₹8,220Cr.",
"Current Price": "₹46.5",
"High / Low": "₹54.0/37.0",
"Stock P/E": "49.4",
"Book Value": "₹3.46",
"Dividend Yield": "0.22%",
"ROCE": "54.6%",
"ROE": "46.9%",
"Face Value": "₹1.00"

Easemytrip - 15% upside expected - lets wait for break!Eyeing Easemytrip🚀 Potential gem or overhyped? Share your thoughts
Seems potential upside - if takes support on 200 - can reach 52

Double Digit Stock - EASEMYTRIP📊 Script: EASEMYTRIP
📊 Sector: E-Commerce/App based Aggregator
📊 Industry: Travel Agencies
Key highlights: 💡⚡
📈 Script is trading near middle band of BB.
📈 MACD is giving crossover .
📈 Double Moving Averages are on urge of Crossover.
📈 Right now RSI is around 54.
📈 One can go for Swing Trade.
⏱️ C.M.P 📑💰- 46
🟢 Target 🎯🏆 - 51
⚠️ Stoploss ☠️🚫 - 43
⚠️ Important: Always maintain your Risk & Reward Ratio.
✅Like and follow to never miss a new idea!✅
Disclaimer: I am not SEBI Registered Advisor. My posts are purely for training and educational purposes.
Eat🍜 Sleep😴 TradingView📈 Repeat 🔁
Happy learning with trading. Cheers!🥂

EASEMYTRIP Swing entry Suggestion.Trading strategy is well explained in charts.
The deciding factor in this trade will be 50 ema on weekly time frame. Also a close above or below the healthy candle, which can be also called as 'Arokya" Candle.

Range boundNSE:EASEMYTRIP
Fundamental - shows weaknesss and range bound on a weekly time
Promoter dec shareholding
Could go short ~-25% for a couple of weeks and rebound unless negative news hits the stock or macro worsens. Could go long for ~+45% if support sustains

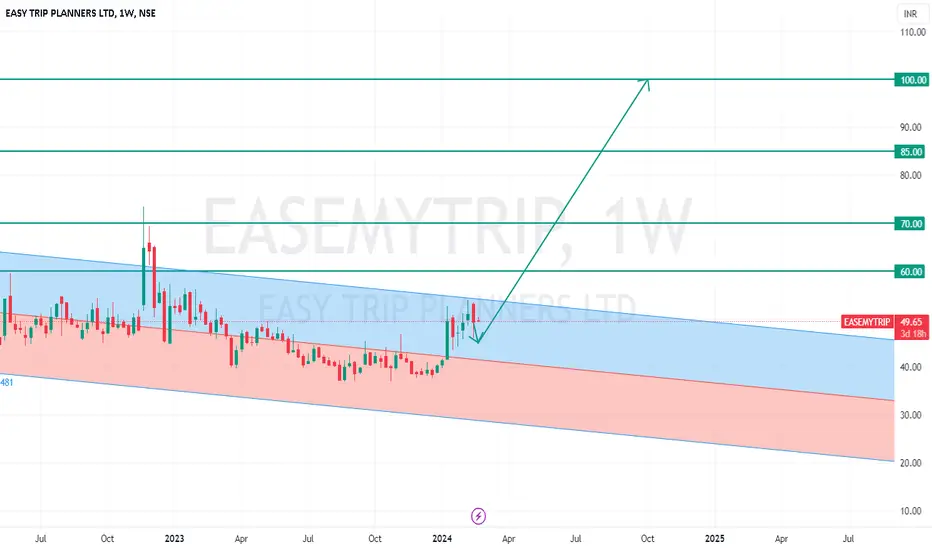
EaseMyTrip - Long for positional trade setup #Freshivew 19th Feb 2024
*Ease Mytrip - CMP 49.65 / Positional Trade*
*Buy Range 46 - 50 / Strict Stop Loss 36*
Target 1 - 60
Target 2 - 70
Target 3 - 85 / 100
Disclaimer: This is my view and for educational purpose only.
Easy trip Looks good for a swing and momentum buy
Can see a good momentum above 59
Sl 43
Tgt 80 90 100
Ask your financial advisor before buying only for educational purposes

Go Long - Ease my TripEase My trip has come out of the consolidation and has started its journey. May Hit All all-time highs within the next few weeks. Also, the holiday season is approaching hence there can be good growth opportunities for the company

The Unspoken Mystery behind SL Hunting - Example: EaseMyTripThe Unspoken Truth & Mystery behind Stop-Loss Hunting:
*** The Most Important Point ***
Many Training Academies & Experts say it is Most Critical to have SL, but where ? How much % ? In Equity Delivery Trading (Not F&O / Not Intraday) – when you have done thorough analysis of stock and sector, more than SL, patience is key. Understand the Unspoken Truth – In Trading, Money is not grown organically – the Loss of one person gets to another one as Profit.
If Everyone knows a scrip will bounce from a Strong Support – then how will Big Players make money ? By Cheating us, By Faking a Breakdown Scenario, By Stretching beyond our SLs. Although no one knows where we have placed our SLs, Big players know for the fact that a Retail trader won’t have their SLs beyond 10-15%. That’s the normal capacity. So, they try to shatter your patience, break your SL by a Fake Breakdown just beyond an average Retail player. Once our SLs have been hit, then they will pump in money aggressively to take the price Higher. This will hit the SLs of other set of Retail players who may have Shorted the scrip Intraday / F&O when the support was broken.
Voila – the Big Players now have hit SLs of Retail players on both sides and will take the price much higher. On a Chart – this will appear as “Wick” on higher timeframe. A proper Breakdown of Support on Daily timeframe will appear as Wick on Weekly and weekly breakdown appears as Wick on Monthly.
2) Pattern Negation:
While Taking a trade using Breakout patterns (Rounding Bottom, Inverted H&S, Cup & Handle etc…), the Pattern is Deemed as Negated when the price re-enters below the BO zone. But watch carefully on higher timeframe to ensure it is not a Fake Negation. At least we need to have patience to confirm negation of Pattern on Weekly Close. Even if it gets negated on Weekly – do not exit the trade on SL. Understand where the next major support is. Only if it is far down below – take a calculated decision to exit the trade on SL. Else hold patiently for the price to take support from the next Demand zone and bounce back. 9 out of 10 times (unless the sector itself is in negative sentiment) the price will bounce back / goes sideways accumulating power from the Demand zone.
In the case of EasemyTrip - The Falling Parallel Channel / Flag Pattern breakout happended on Weekly and it had to cross the resistance at 46 to be deemed a successful Breakout. But even after Breakout, the scrip started falling down sharply below the 46 Resistance zone on Daily. But look at the Weekly Candle - Only Wick below. for 2 Weeks Big Players tried to scare-off weak hands by faking Breakdown again and again on Daily Timeframe. But on Weekly - for both the weeks only Wick is below 46 and candle ended above 46 zone confirming the Flag Pattern Break-Out as Successful and Still Valid
Disclaimer:
Stocks-n-Trends is NOT a SEBI registered company. We do not provide Buy / Sell recommendations - rather we provide detailed analysis of how to review a chart, explain multi--timeframe views purely for Educational Purposes. We strongly suggest our followers to "Learn to Ride the Tide" and consult your Financial Advisors before taking any positions.
If you like our detailed analysis, please do rate us with your Likes, Boost and share your comments
-Team Stocks-n-Trends

Easemytrip will grow Easemytrip's bullish breakout suggests potential price growth. Favorable market sentiment and increased demand may drive the stock higher, presenting an opportunity for investors to benefit from the positive momentum.

easemytriphas introduced a new subsidiary named EaseMyTrip Insurance Broker to diversify its service portfolio and tap into the insurance market, according to a Wednesday filing.

EASEMYTRIPStock name = Easy Trip Planners Limited.
Weekly chart setup
Chart is self explanatory. Levels of breakout, possible up-moves (where stock may find resistances) and support (close below which, setup will be invalidated) are clearly defined.
Disclaimer: This is for demonstration and educational purpose only. this is not buying and selling recommendations. I am not SEBI registered. please consult your financial advisor before taking any trade.
EASY TRIP PLANNERS Upcoming LevelsHi, After PM’s endorsement and the natural beauty of the islands, Lakshadweep is poised for a tourism boom. This could also benefit for NSE:EASEMYTRIP .
As per my analysis, best buy level to take positional entry is 46.50 with stop loss of 36.00 (-10.50 Points risk). Expected upside target would be 61 (+14.50), 76 (+29.50) & 86.50 (+40).
This is could be low risk and high reward idea.
Note: This is my personal analysis, only to learn stock market behavior. Kindly do your own analysis/research to take any trade. Thanks.
