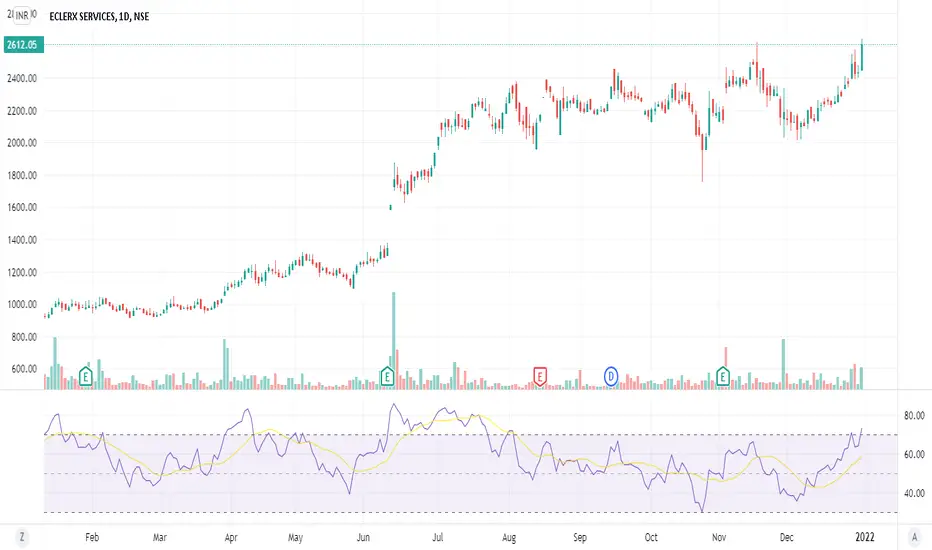
ECLERX looks good ECLERX
cmp 2612
trgt 5%- 10%
Disclaimer:
All information shared is just for educational purposes.
By no means shall we be accountable for any debits/losses amounting out of it.
We are not SEBI registered Analysts, so please consult your Investment Advisor and take rational decisions.
ECLERX trade ideas
eClerx (CMP1029) heading to 1125 levels? Must sustain above 1050eClerx heading to 1125 levels? Lets see how it goes above 1050
Inverse H&S pattern breakout above 1050 levels.
Must sustain these levels for big momentum

FaakBought tracking position in it, waiting for few candles to sustain above resistance level.
Will add more as it starts giving me evidence of next move.

ECLREXLooks great keeping in mind the BUYBACK.
2850 is the buy back price
so seems like an easy money option to hold it

Convincing breakoutThe stock has given a convincing breakout above level 2350. The is continuously outperforming index since 830 level. Still huge upside of appx 40% is due.

ECLERX has broken market structure NSE:ECLERX is above 200MA on the Weekly chart for the first time since July '18. A few days ago, I'd talked about how so many stocks that were underperforming since the past 3-4yrs are also breaking the bearish market structure.
While it does appear to be heading into some congestion, the broader trend has improved a lot thanks to the post-COVID bull run.
Note: My ideal buy price would've been when the price took support in the pullback around the blue horizontal line. The price is clearly quite high and it wouldn't make for a good risk-reward for my preferred setup. But that doesn't change the fact that it's an important hurdle cleared!


Eclerx - Bull run may continuePrice took support at trendline and also horizontal support zone.
Bullish engulf candle.
Buy above 1202
SL 1098
Target 1325-1350


ECLERX Weekly Chart - Positional (Bull Flag in making)This analysis is purely based on Price Action and Chart Patterns.
Analysis is done on Weekly Time Frame, Hence it may take few weeks to couple of months for price to reach target. Traders should consider this before entering into the trade.
As can be seen from the image, price gave the breakout and then has come down to retest that level as support.
Also, a possible bull flag pattern can be seen in the charts.
If the stock price consolidates at the support and gives reversal signal, one can go long in the stock with SL either little below the support level or below 50EMA (since the stock moving with 50EMA)
Targets are shown in the image itself.
*Trade on your own risk and money management*
Feel Free to comment for any queries or suggestions


eclerx - getting ready to comeback on trackeclerx - looking strong to make a good move above 1000 for another 15% move. need to cross above 1015 on closing basis. Keep a tab on monthly clsoing, the RSI needs to be above 60. Let us c
DISC: Not a SEBI Registered. I post charts for my own study.

eClerix Services CMP 869Today after good consolidation, the stock has given good breakout with Huge volume. Fundamentally the stock is very good and have brilliant growth aspects. Sector wise I am very bullish on IT space for next 2-3 years.
Target: 1000+
Time Frame: 1-2 months
Stop loss: 790 on weekly basis


Weekly Breakout _Eclerx LTD- This is a weekly Breakout after 2years
- Double bottom
- RSI divergence
- Positive EMA
- Favorable Risk/Reward ratio

Bearish Crab in ECLERX in Weekly time frame.Hello,
Bearish Crab may form in ECLERX in Weekly time frame.
Note: This chart is only for reference and study purpose.

positional setup break outfundamentally good one and break out...watch out
Company is virtually debt free.
Company has a good return on equity (ROE) track record: 3 Years ROE 22.61%;;


