Engineers India Engineers India Weekly chart breakout & retested the level buy on dip.
Target 275, 320 & 370...
ENGINERSIN trade ideas

Engineers IndiaUptrend shown by HH Hl
Stock above 10 & 20 ema with volumes
rsi broken its range n above 60now

ENGINEERS INDIA (D)Engineer India forming a cup and handle pattern. Traders watching for potential breakout signals from this bullish pattern.

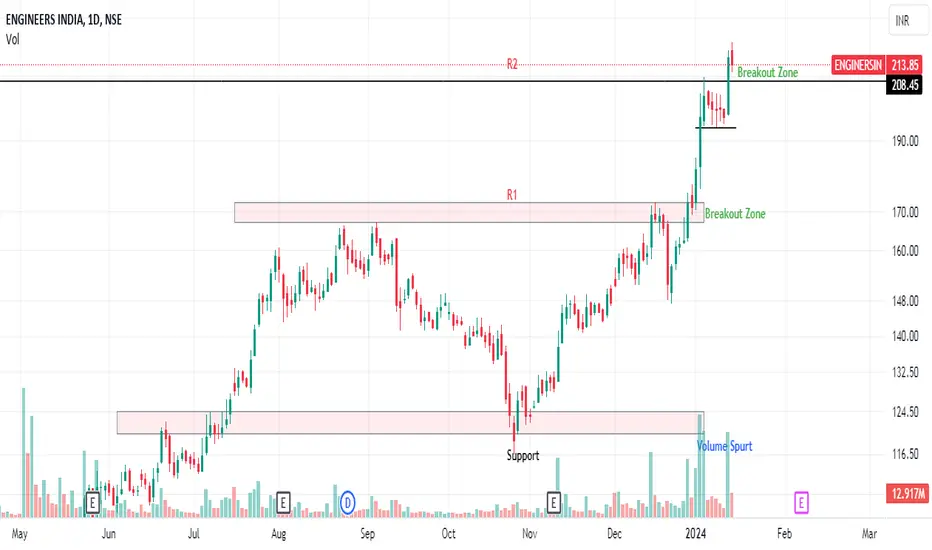
Descending broadening wedge on ENGINERSINENGINERSIN formed a descending broadening wedge on daily chart. Price broke out of resistance line today with strong volume. Price close high indicating bulls are out there. Note the volume when price falls as it stays below average line indicating sellers are not willing to sell at lower price. This is also confirmed by volume hike when price is moving high. However, wait for close above breakout candle high to enter long. Stop loss can be had just below breakout candle low with target the width of broader side of wedge. Good risk reward on this trade.
Hope you like this idea, if so please boost this idea or leave a comment below on what you think. I'll be glad to hear from you. Otherwise happy trading :-)

Trendline breakout strategyprice is coming from strong demand zone and we can look for now long trade .
As per our given viewpoint we can also do a swing long trade or put as a investment it can give almost a 30% best stock to invest now. NSE:ENGINERSIN

Must Have It In Your Portfolio You should definitely have it your portfolio..
CMP 212
Buy at CMP
Target 🎯 For multibagger
Sl below 130 closing basis
PRO's:
Debt free
Low P/E
High ROE
High ROCE
Con's:
Decrease Promoter Holding
Low EPS
Decreasing Profit
Note : It's my own views on the mentioned stock not any recommendation for the buying or selling of the mentioned stock .. its for learning purpose.


Engineers India BUY Here is my chart for Engineers India. I have entered in at 233.50. There is resistance near 236, if you want to be safer you guys can probably enter after 236 is broken. Overall we are targeting 269, however, we also have a small target of 9% attached in the charts. Follow along if you may. No buy sell reco NSE:ENGINERSIN

ENGINEERS India Loking good for the upside momentEngineers india loking good moment if sustain above 269 more upside seen possible target for the 299-325-360-400-477

ENGINERSIN - Ichimoku Breakout📈 Stock Name - Engineers India Limited
🌐 Ichimoku Cloud Setup:
1️⃣ Today's close is above the Conversion Line.
2️⃣ Future Kumo is Turning Bullish.
3️⃣ Chikou span is slanting upwards.
All these parameters are shouting BULLISH at the Current Market Price and even more bullishness anticipated AFTER crossing 262.
🚨 Disclaimer: This is not a Buy or Sell recommendation. It's for educational purposes and a guiding light to learn trading in the market.
#CloudTrading
#IchimokuCloud
#IchimokuFollowers
#Ichimokuexpert
Excited about this analysis? Share your thoughts in the comments below!
👍 Like, Share, and Subscribe for daily market insights! 🚀
#StockAnalysis #MarketWatch #TradingEducation #ichimoku

Soon to breakout Engineers India after 14 yearsPublic sector enterprises , that is the government companies in India are showing strength and value buying last year or two. The mindset/trust of investors and traders is gaining in these companies. But we need to ensure that the fundamentals and technicals are respected.
One such company following the above criteria is 'Engineers India' .
This script is near 14 year resistance level of around 160 and has been consolidating and retesting the 160 levels . The fundamentals of the company has improved and its available at fair valuations considering its earnings. Its in Engineering Procurement and Construction ( EPC ) segment. And we can see India is largely doing infrastructure spending and this company is capable enough the work on it.
Tecnically, once 160 levels are broken and we see weekly close above 160-170 zone then levels of 300 can be seen based on Fibonacci levels and if we calculate height of the zone in which it was present from last 14 years then also targets are around 300-325 levels.
Stop loss can be below 140 levels on weekly closing basis .
The volumes are supporting the up-move which is a good indication.
Enjoy the move and hope you are making most of it by learning how the momentum stocks show strength :)
Happy trading ;)
If you like my analysis , then do follow me for more updates and like it so others can also benefit from this :)

Engineers India Ltd has given a strong breakout Engineers India Ltd has given a strong breakout on daily chart with huge volume spike.
we can consider this stock at CMP 214 with sl of 190
Engineers India Breakout on weekly time frame Breakout on weekly time frame, multi year Breakout , might create new highs

ENGINERSINDIA Multi-year breakoutWatch out for multi year breakout, momentum will be fast post breakout.

ENGINNERS INDIA MULTI YEAR BREAK OUTthis pse stock has given a massive break out with a consolidation of 13 year this beauty has given a break out with pumping volume should be in your radar for the 2024 election rally


Engineer India - Study and analysis Hello traders,
Engineer india is preparing for abbull run basis on the analysis that I have done we can see that cup and handle breakout is likely to take place and target looks amazing, giving resistance may play important role here .
Cup and handle considered one the best breakout that may led to long bull run however it's success rate are 50-60% to get proper breakout we must wait for the resistance to provide the breakout first then weah fins the giving target in the chart..
Imp note - This post is only for study purpose investors are advised to get in touch with their financial advisor to get investment tips I'm here to share ideas and learning for study purpose

EnginersinNSE:ENGINERSIN
Reverse From Support
Rsi on Daily candle is above 50 for 7 days
After 2 days of forming doji candle forming bullish candle
can buy abpve 133
Sl- 115
Tgt- 145/155/163
only for educational Idea or purpose

ENGINEERS IND: Trading near supportIt is trading near support and good bullish with volume.
We can expect good up move from here.

ENGINERSIN resuming uptrend?A strong uptrend looks to be resuming in the same direction with the price taking support on 13EMA levels. DMI is also bullish indicating potential upside left. Can be a good short term long trade
Entry - 154
Stop Loss - 145
Target - 175/192

Engineers India Swing Trade OpportunityThe stock is very strong in Monthly, weekly, Daily, has been on a very strong uptrend.
On the daily time frame it has moved out of 1 month old consolidation zone.
So one can look to enter the stock at the demand levels marked for a quick move till the supply zone of 180.
A good 10% opportunity exists.
Trade at your own risk.
Happy trading!

ENGINERSIN UPFLAG BREAKOUTBreakout done only waiting for sma crossover for further conviction.
seems like a good buy around the 155 level by that time even sma crossover should happen
Target - 200
Sl - 146.5

ENGINERSINENGINERSIN Chart Analysis........23/07/23
ENGINEERS are currently trading near their Fibonacci level 0.618. Now if some correction comes from here and the price is found at 127 level. So that same buying level will remain. Here the target of the up side is marked on the main chart, which comes to the mid-term 227 level.
Enjoy !
