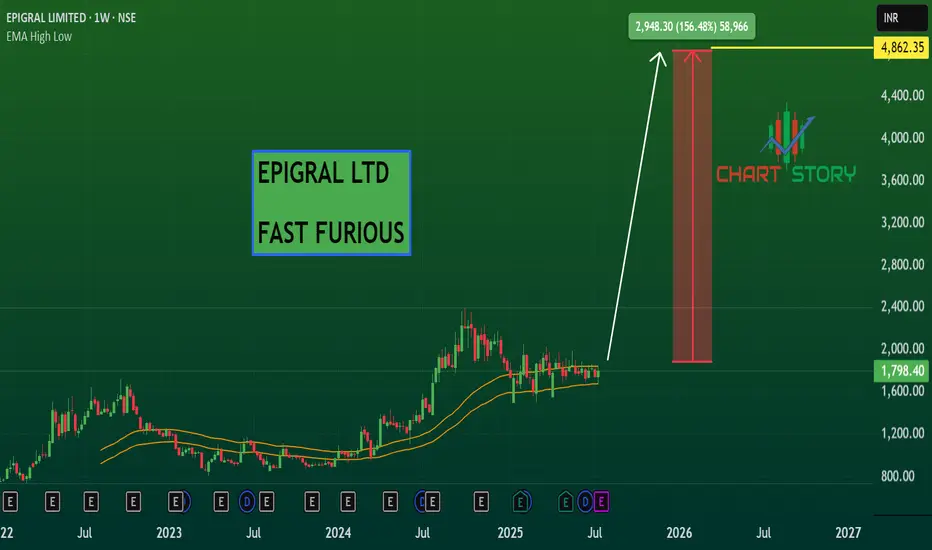
EPIGRAL - PARABOLIC BUYNSE:EPIGRAL Weekly parabolic location with accumulation for more confirmation one more buyers candle needed.
EPIGRAL trade ideas
Cup and Handle (potential bottom formation and reversal set-up)Open to Questions.
the stock seems to be forming a base around its recent bottom amidst the market correction (NIFTY 50).
shakeout day and recovery can be seen clearly.

EPIGRAL LTD S/RSupport and Resistance Levels:
Support Levels: These are price points (green line/shade) where a downward trend may be halted due to a concentration of buying interest. Imagine them as a safety net where buyers step in, preventing further decline.
Resistance Levels: Conversely, resistance levels (red line/shade) are where upward trends might stall due to increased selling interest. They act like a ceiling where sellers come in to push prices down.
Breakouts:
Bullish Breakout: When the price moves above resistance, it often indicates strong buying interest and the potential for a continued uptrend. Traders may view this as a signal to buy or hold.
Bearish Breakout: When the price falls below support, it can signal strong selling interest and the potential for a continued downtrend. Traders might see this as a cue to sell or avoid buying.
20 EMA (Exponential Moving Average):
Above 20 EMA(50 EMA): If the stock price is above the 20 EMA, it suggests a potential uptrend or bullish momentum.
Below 20 EMA: If the stock price is below the 20 EMA, it indicates a potential downtrend or bearish momentum.
Trendline: A trendline is a straight line drawn on a chart to represent the general direction of a data point set.
Uptrend Line: Drawn by connecting the lows in an upward trend. Indicates that the price is moving higher over time. Acts as a support level, where prices tend to bounce upward.
Downtrend Line: Drawn by connecting the highs in a downward trend. Indicates that the price is moving lower over time. It acts as a resistance level, where prices tend to drop.
Disclaimer:
I am not a SEBI registered. The information provided here is for learning purposes only and should not be interpreted as financial advice. Consider the broader market context and consult with a qualified financial advisor before making investment decisions.


Epigral LtdEpigral Ltd
Epigral Limited, formerly known as Meghmani Finechem Ltd, incorporated in 2007, is a leading integrated manufacturer of chemicals in India. Epigral’s Dahej facility is a backward and forward integrated and automated complex with a well-planned infrastructure.
In India, Epigral is the first to set up an Epichlorohydrin plant and largest capacity plant of CPVC Resin. Epigral is also a leading manufacturer of Caustic Soda, Caustic Potash, Chloromethanes, Hydrogen Peroxide, Chlorine and Hydrogen.

Meghmani FinechemMeghmani Finechem has given Multiple Patterns Break Out with huge volumes.
The company has been a consistent performer and is also trading at around 13 times Earnings.
This makes for a wonderful opportunity.


EPIGRAL - TGT PREVIOUS DOUBLE TOP IN WEEKLY TIME FRAME?Stock looks good to give a decent return of 15-25% in a short span of time
One other good stock to be in the portfolio
Disclaimer: This is not a recommendation and is purely for education purposes only.

Epigral- Nice BreakoutEpigral- Nice Breakout
Capital to be deployed- 20k
Investing Price -1250-1270
Breakout Price -1221
Stoploss -1099
Targets -1509-1796
#epigral #StockMarketindia #StockToWatch #StocksInFocus #stockstowatch #StocksToTrade

EPIGRAL trendline breakresistance 1160
support 872
Meghmani Finechem Limited (MFL) is part of the Ahmedabad-based Meghmani Group. It was incorporated in September 2007 as a subsidiary of Meghmani Organics Ltd (MOL) but was demerged in April 2021. The company is primarily engaged in manufacturing and selling of Chlor Alkali & its Derivatives with backward and forward integration facilities and also engaged in trading of Agrochemical products.

Epigral base is madeEpigral base is made
keep sl as 895 day close basis
Buy above 937
Expecting 12-30 % move in coming weeks.

EPIGRALThis stock is in consolidation phase. taking support near 880 level. this week candle looking candle like elephant candle also it seems that selling is over because volume is very low on selling day. so at this price it seems it may be gud buy. sl will be green weekly candle low.
SL 880
target will be weekly candle trailing basis..

EPIGRELVolume backed breakout took place today
stock witnessed a strong upmove today
it witnessed around 8% gains with around 18X more volume than average weekly volumes
support and resistance as mentioned on charts

Epigral - Good Reversal betLooks like a good reversal candidate for ATH + New High.
Unlike its previous reversals, The confirmation candle has good volume. Respecting the trend line support and following the Fib levels.
Can add any dips or at 1040. My first target is 1400.
Traders SL at 970 and Investors nothing to worry

EPIGRALepigral chart analysis intraday key levels buying only when epigral open big gap up and make range breakout up side / uper side price-action.
must respect STOPLOSS
give small losses take big profits

long spot 973MFL India Limited is an India-based transport and logistics company. The Company has a self-owned fleet of mixed variety high-volume/heavy-weight cargo carriers along with a diversified portfolio of transportation services that includes high-capacity trucks and trailers.


meghmani finechem 1D buy cmp target 1246MEGHMANI FINECHEM 1D
buy cmp
target 1246
risk reward 2.88
sl 970

Resistance BreakoutPlease look into the chart for a detailed understanding.
Consider these for short-term & swing trades with 2% profit.
For BTST trades consider booking
target for 1% - 2%
Please consider these ideas for educational purpose
Comment below if you are looking for any answers.

Meghmani Finechem Ltd - 13.04.2023Meghmani Finechem Ltd - 13.04.2023
The Price is above EMA
The Stock can be considered for the long upside movement with support @ 951/-
Watch out for the price action
DISCLAIMER: This is not a stock recommendation. The post is only for learning purposes, understanding candlestick patterns.

Meghmani Finechem Limited - Multiple Indicators📊 Script: MFL (MEGHMANI FINECHEM LIMITED)
📊 Nifty50 Stock: NO
📊 Sectoral Index: N/A
📊 Sector: Chemicals
📊 Industry: Specialty Chemicals
Key highlights: 💡⚡
This stock pick is according to my study. I have use few indicator that is
BOLLINGER BAND
MACD
RSI
DOUBLE MOVING AVERAGE
VOLUME
📈 Script is trading at upper band of Bollinger Bands (BB) and giving breakout of it.
📈 Crossover in MACD .
📈 Already Crossover in Double Moving Averages.
📈 Volume is increasing along with price which is volume breakout.
📈 Current RSI is around 76.
📈 One can go for Swing Trade.
⏱️ C.M.P 📑💰- 1701
🟢 Target 🎯🏆 - 1829
⚠️ Stoploss ☠️🚫 - 1638
⚠️ Important: Always maintain your Risk & Reward Ratio.
✅Like and follow to never miss a new idea!✅
Disclaimer: I am not SEBI Registered Advisor. My posts are purely for training and educational purposes.
Eat🍜 Sleep😴 TradingView📈 Repeat 🔁
Happy learning with trading. Cheers!🥂

Meghmani Finechem LtdEducational purpose only
Meghmani Finechem Ltd
mfl #MFL
ROCE-29.0 %
ROE-31.2 %
Stock P/E-19.2
Sales growth 3Years-29.7 %

MFLFalling wedge in an uptrend with double bottom.
All Moving averages converging
Waiting for Elliott oscillator to turn green
Con :
No false bar on top yet
Pro.
No false bar in bottom too
