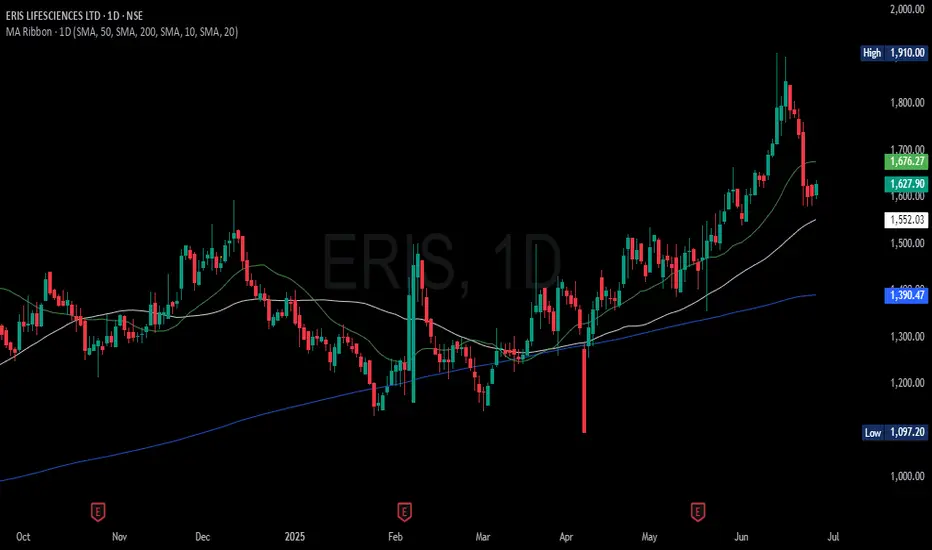
ERIS Ready to goEris Life Science, came down from High now nice 3 days consolidation and volume is lowest, looks to move up from here
ERIS trade ideas

Positional Setup – ERIS Lifesciences (CMP ₹1503.90)🟢 Current Price Action:
CMP ₹1503.90, up +2.29% today.
The price is testing a strong resistance zone near ₹1540–₹1555 (highlighted by the purple box).
Multiple rejection wicks near this level earlier = significant supply zone.
⚙️ Technical Outlook:
Resistance zone: ₹1540–₹1555 → needs a daily close above this level for breakout confirmation.
Strong support: ₹1350 and deeper at ₹1146 (historical swing low).
Rounded bottom/base formation observed, with higher lows in recent sessions = bullish bias.
✅ Positional Trade Plan
Parameter Level
🎯 Entry ₹1500–₹1510 (accumulate zone)
🔔 Breakout Watch for close > ₹1555
📌 Stop Loss ₹1390 (or ₹1350 for wide SL)
🎯 Target 1 ₹1700
🎯 Target 2 ₹1850+ (if momentum sustains)
⏳ Timeframe 3–6 weeks
🧠 Setup Rationale:
Price congestion near resistance shows accumulation.
Break above ₹1555 will confirm multi-month breakout.
Pharma sector gaining traction recently → tailwind support.

Resistance breakout Waiting for price break resistance level;
Looks good opportunity in breakout side.
Keep it simple no rocket science.
Will follow risk rewards.
No buy sell recommendations just for learn technical.

ERIS LIFE - LONGNSE:ERIS Weekly parabolic bullish formation with accumulation and buyers. Macd also positive setups.

Channel Pattern 6 Years Range Channel Consolidation and Pattern To Pattern Breakout.
And price shifted to Uptrend direction.

ERIS LIFESCIENCES LTDERIS breaking out
swing trade with a stoploss of 5% can be initiated from here with targets of 20-25%

Eris Lifesciences Ltd. - Swing Trade SetupWe have a potential long trade opportunity in Eris Lifesciences with a defined entry and target.
Entry Price: 1368.40 (Confirmed after the 15-minute candle broke above the entry zone at 1350)
Target: 1624
Stop Loss: 1213.05 (This stop loss is considered valid if a daily candle closes below this level)
This trade setup offers a solid risk-to-reward ratio with the target level at 1624. As always, manage risk according to your trading plan.
Disclaimer: This analysis is for educational purposes only and not financial advice. Trade responsibly and use proper risk management.

SWING IDEA - ERISStock is currently trading near its Multi Year Support/Resistance zone of 836.
While 836 has been a strong Resistance/Rejection point twine in 2018 and 2021, this has turned out to be a good Support point currently since Sep 2023 during multiple revisits.
MACD Cross is also under play at this time.
If all goes well, the stock could start seeing some new highs in the coming weeks.
Stock has also had a good Earning report this past week, so lets hope for a move upward.
Note: Stock has been consolidating in the same zone for nearly 6 months now. With good volumes, it could very well see new highs.

ERIS Lifesciences Ltd
Targets in chart - SL 726
FUNDAMENTALS :
Market Cap
₹ 11,116 Cr.
Current Price
₹ 817
Stock P/E
29.7
Book Value
₹ 161
Dividend Yield
0.90 %
ROCE
17.0 %
ROE
18.2 %
Face Value
₹ 1.00
Promoter holding
52.9 %
EPS last year
₹ 28.1
EPS latest quarter
₹ 6.98
Debt
₹ 877 Cr.
Pledged percentage
11.4 %
Net CF
₹ -2.34 Cr.
Price to Cash Flow
38.1
Free Cash Flow
₹ -550 Cr.
Debt to equity
0.40
OPM last year
31.8 %
OPM 5Year
34.5 %
Reserves
₹ 2,182 Cr.
Price to book value
5.06
Int Coverage
12.5
PEG Ratio
5.77
Price to Sales
6.34
Sales growth 3Years
16.2 %
Profit Var 3Yrs
8.62 %

Eris Lifescience-Nice BreakoutEris Lifescience-Nice Breakout
Capital to be deployed -20k
Investing Price -1150-1170
Breakout Price -1141
Stoploss -987
Targets -1604
#erislifescience #StockMarketindia #StockToWatch #StocksInFocus #stockstowatch #StocksToTrade

ERIS LIFESCIENCES : 10% + MOVE EXPECTEDERIS LIFESCIENCE
Got stuck on a weekly TF in a range.
Range B/O will lead to fast move towards TGT-1 depicted in the RED path
Retracement buy trajectory is depicted in the BLUE path.
Trade according to the Price Action developing along these paths.

ERIS Breaks Cup & Handle Resistance: What's Next?This content is for educational purposes only.
ERIS has broken above the handle's resistance with a powerful candle, and this upward move is backed by strong volume. It could reach the target soon.
I'll share straightforward charts to make it easy for everyone to understand. Stay tuned for more ideas like this. Meanwhile, please like, share, and follow :)
Thanks,
Wayfarer
Keep learning and earning.
Disclaimer: We are not registered financial advisors, and the views shared here are personal opinions. It's important to consult with your financial advisors before making any investment decisions.

Eris Lifesciences Triangle Pattern Taking a look at the weekly chart of Eris Lifesciences, I've noticed something interesting. It's been testing the 830-850 levels for some time , and recently managed to break through. Now, it's forming a triangular pattern around that price. This setup seems promising to trade. I suggest setting a stop loss of around 4%-10%, with potential targets ranging from anywhere between 20% to 40%.

Eris Lifesciences Triangle ConsolidationEris Lifesciences has been consolidating effectively within a triangle pattern, finding strong support at the trendlines. This presents an ideal opportunity for accumulation, either upon breakout or currently, with a stop loss positioned below the supporting trendline. If you're getting in now, use a stop loss around 800. If you're buying during the breakout, adjust your stop accordingly. Aim for a risk-reward ratio of 1:2 or 1:3. There's big potential for gains.

Eris looking attractive.Eris Lifesciences Ltd. is presently engaged in manufacturing and marketing of pharmaceutical products. It has presence in high growth chronic, sub chronic and acute therapeutic areas that require high intervention of specialist and super specialist doctors. Apart from this, it has a portfolio of 112 Mother Brands across therapy areas. Eris Lifesciences Ltd CMP is 917.3.
The Negative aspects of the company are High Valuation (P.E. = 32.2), Declining annual net profit, declining cash from operations annual, FIIs are decreasing stake, MFs are decreasing stake, High promoter pledge, Promoter Holding decreasing. The positive aspects of the company are No debt.
Entry can be taken after closing above 936. Targets in the stock will be 952 and 972. The long-term target in the stock will be 988 and 1020. Stop loss in the stock should be maintained at Closing below 806.
The above information is provided for educational purpose, analysis and paper trading only. Please don't treat this as a buy or sell recommendation for the stock. We do not guarantee any success in highly volatile market or otherwise. Stock market investment is subject to market risks which include global and regional risks. We will not be responsible for any Profit or loss that may occur due to any financial decision taken based on any data provided in this message.

New Cup and Handle chart pattern form in ERIS New Cup and Handle chart pattern form in ERIS
Do your own research before investing

#ERIS BULLISH SETUP#ERIS in bullish trend from last few weeks been in sideway and now getting ready to break consolidation and trending again, Stock in bullish rectangle pattern and if it break above the range with volume only then we enter in trade.....

Eris Lifesciences Ltd *Eris Lifesciences Ltd.*
C&H Formation on Yearly Basis.
C&H Price Trendline BreakOut. Should Sustain.
Major Resistance at 820/849. Once Crosses / Sustains. Then Good to Go.
RSI: 1H < D>W>M
Note: Promoters Pledge at 11.4%
Forayed in Dermatology in FY22.
Acquired Domestic Formulations business of Strides.
Acquired Brands from Glenmark & DRL.
Spike in Debt.
Trail SL with Upside.
Book Profit as per Risk Appetite.
Do Your Own Research as well. This is an Opinion.
Happy Investing 😇

Eris life science complex cup and hane 14% up side possible?Eris life science complex cup and hane 14% up side possible?
Do your own research before starting investing

ERIS: Looks Good For a UPMOVEERIS Looks Positive
Promoters are buying every quarter in this company.
FIIs and DIIs are also invested in this company.

ERIS LIFESCIENCES LTD.The stock is forming Cup and Handle pattern on charts and if we take handle to complete as our target then it's almost 10-12% returns, which I expect it to give in around 2 months time.
If you can keep the stock for short to medium term then you can even see the stock hitting 4 digit mark.
The fundamentals of the company is good. Though the promoters have decreased there holdings a little but FIIs and DIIs have increased there holdings which is a positive sign. Sales figures QoQ and YoY have also gone up. Reserve and Surplus have also increased which is also a positive sign. Contingent liabilities of the company stands minimal at 26 Crores which is almost negligible. Debt Equity ratio of 0.02 signals a healthy balance sheet. There are few negatives but so many positives along with current momentum in stock can't be overlooked. Surely a stock to watch out for.
I am not a SEBI registered analyst. The view here is my personal view and is not a trading or investment advise to anyone. Please consult your financial advisors before making any position.

Eris Life BreakoutThe stock has broken out and retested, therefore may undergo a reversal rally. Trade is supported by Supports Nearby.
Risk Reward Ratio - 2:1
SL is placed below the support zone & the lower trendline. The target is placed near resistance.
