EscortsThis has given a break down below the ascending triangle pattern one can go short on Escorts with stoploss above 670 for the target of 580
ESCORTS trade ideas

escortsshowing weakness as not going upside and stays in range for 4 sessions with bearish divergence and stable volume can give us good downside move. plan trade accordingly.


[2BB[WEEKEND][IB] ESCORTS LONG TRADEShort Escorts at PDL break
Setup invalid, if:
1. PDH breaks
2. Gap up/down in 15m tf

ESCORTS MY WILD HORSEPurely chart analysis. For fundmental analysis DYOR.
I first heard about this stock thanks to TradingHub. So thank you for sharing your analysis.
In this analyisis in comparison with tradinghub I want to look at the possible big picture.
After almost 20 Years of "Wyckoff like" ranging price there was finally a break out in late 2016.
After a top on mid 2017, the stock plummet from 1000 to the value for a more than 50% devaluation.
there are some insight that tell me about a good time to buy.
In this biweekly chart we can see that the 20 years resistance around 267 dollars has been already cleared after break out and is to consider as an unbreakable level.
Actually we are at target of a perfect ABC corrective phase in gartley entry point inside a falling wedge.
In the biweekly chart we can see that price range around the 200EMA was a fundamental level since we have information about it. It acted as support, but also as relevant resistance (late 2008 leading to all time low) and downside breakout level (mid 2011). After been cleared in october 2014 was after 1 support on may 2015 the basis of the break out of the 20 years top (January 2016). This would be nice target after a relevant correction.
Geometrical I doubled the wyckoff channel in equal proportions setting the maximum target on top of the double of the first top, corresponding also to the 1.61 extension of the gartley in formation. This would be the maximal target.
BIO

623 SAN; Feel Safe buy zone at 413 or at 444 with SLSl compulsory
If entry point does come, then it would be another ENT (Entry not triggered)

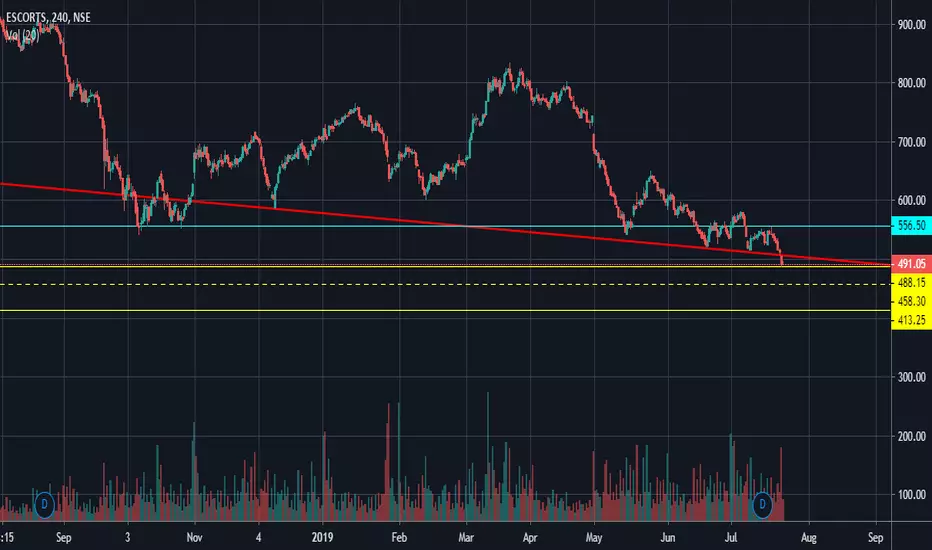
ESCORTSEscorts has broken a trendline and gone on downwards to hit a support zone.
Barring this support level, if it falls further it will see the next support zone highllighted in YELLOW.
The dotted yellow line is also a support area in between the 2 yellow support lines BUT IT IS PRESENT ONLY IN DAILY TF and not on WEEKLY TF.
So the 2 yellow lines are major support levels.

ESCORT : Wait For Pullback Before BUY 450We can see Pullback at 450 and Wait For Reversal Confirmation Upside
BUY & SELL As Per Above Given Chart or
You Can Also set Own Risk reward.
Let see what Will be Next Move.
Warning- I m Not a Financial Advisor this idea Only For Educational Purpose Only.
Thank You !!


268PA Diver buy SignalMany times Market does not provides good and ideal entry points. Hence needs personalized intraday techniques and strategies (PITS) for your entries and exists (Profit taking point 1 (PT1 or PT2) or Stop loss points (SL)).
Disclaimer: Set-up shown here is only for Educational purpose only; This is not a sell or buy recommendation. We are not responsible for any loss or gain; Consult your financial advisor before your execution of any recommended trade.
Set-up presented here is for observational purpose only and most of the set-up designed by WavoZen is based on passive analysis (PA) or static analysis for intraday purpose only to get the basic structure for intra-day short term or ultra-short term purpose only. Most of the set-up is valid for a day or otherwise mentioned. Hence requires your fine tuned personalized intraday techniques and strategies (PITS) based on real-time Active Analysis (AA) to get benefit from these structures or to have minimum loss, if wrong through your PIT Strategies (your trade plan). There are heavy chance that most of the presented stock does not meet set (described) entry conditions, as most of our post are passive analysis (PA). Overnight events, news, major economic data release etc may impact the deviation from the assumed scenarios. If entry conditions and criteria are not meet, then we should not take any chance to enter on assumed scenarios. (ENT= Entry not triggered). Daily post appears on stocktwits.com/WavoZen.


103. PA: Vertica10 to 12% Retrace in 8 days with 60% probabilityVertical run down.
May touch support and bounce with consolidation
Run with SL


Beauty is in the eye of the beholder. // ClassicClassic channel consolidation, anticipatory longs can be added for 5% move.

Escort Long setupEscorts Looks good to test 695/700/705..
Sustainaing 706 can take it to 720/740/760+
CMP 691
SL 670

