ETHOSLTD trade ideas
ETHOS LTD S/R Support and Resistance Levels:
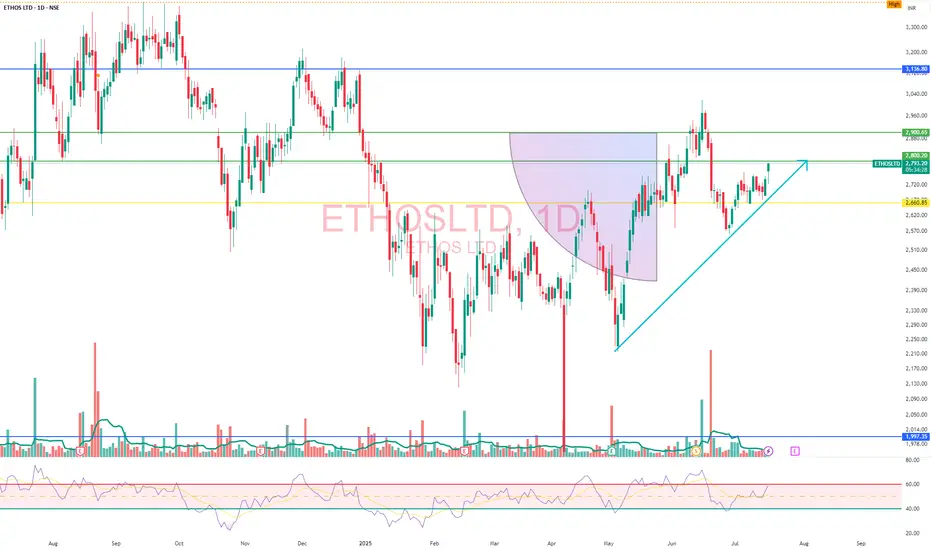
Support Levels: These are price points (green line/shade) where a downward trend may be halted due to a concentration of buying interest. Imagine them as a safety net where buyers step in, preventing further decline.
Resistance Levels: Conversely, resistance levels (red line/shade) are where upward trends might stall due to increased selling interest. They act like a ceiling where sellers come in to push prices down.
Breakouts:
Bullish Breakout: When the price moves above resistance, it often indicates strong buying interest and the potential for a continued uptrend. Traders may view this as a signal to buy or hold.
Bearish Breakout: When the price falls below support, it can signal strong selling interest and the potential for a continued downtrend. Traders might see this as a cue to sell or avoid buying.
20 EMA (Exponential Moving Average):
Above 20 EMA(50 EMA): If the stock price is above the 20 EMA, it suggests a potential uptrend or bullish momentum.
Below 20 EMA: If the stock price is below the 20 EMA, it indicates a potential downtrend or bearish momentum.
Trendline: A trendline is a straight line drawn on a chart to represent the general direction of a data point set.
Uptrend Line: Drawn by connecting the lows in an upward trend. Indicates that the price is moving higher over time. Acts as a support level, where prices tend to bounce upward.
Downtrend Line: Drawn by connecting the highs in a downward trend. Indicates that the price is moving lower over time. It acts as a resistance level, where prices tend to drop.
Disclaimer:
I am not a SEBI registered. The information provided here is for learning purposes only and should not be interpreted as financial advice. Consider the broader market context and consult with a qualified financial advisor before making investment decisions.

Exists 101 in EthosAfter entry if you face big red candles how to deal with them, more over NSE:ETHOSLTD ,
you exit post fall down.

Long ETHOSEthos is a business consisting of trading of watches, accessories and luxury items and
rendering of related after sale services. The sector of business is a niche segment and
expecting the future with more people preferring premium segment watches as a
status symbol and the brand has an array of premium watches pricing from lakhs to
crores. The stock is yet to get famous among the public, but once it gets it hype, it can
give ample returns. Stock has given positive results for the past 2 years and expecting the same to continue.


ETHOS LTDETHOS LTD (1D)
CMP 1654.85
Stock price retested previous Resistance levels
Tightening near breakout level
Key moving averages sloping up
Sustained Earnings gap

ETHOS LTD - TECHNICAL ANALYSISLets Wait and Watch for a Perfect Entry....
......................................................
This is not any investment/swing/intraday trade call/advice.
If you like, please like the idea.
......................................................
Hi, I would like to share this idea with you all on the basis of the price action analysis.
Pleasure to have you here. This is an trading/investment analysis done for the Tickr, and potential in the Technicals.
if you like the idea please like the post :) It will be a motivation to further such ideas.
Disclaimer Note:-
1) This is just an analysis setup and no advice to take any position.
2) If you are making position, please have your risk to reward analysis and then enter.
3) The analysis and target shared does not mean i trade in them, entry and exit depends on the market open and other factors.

EthosAnnual growth of 46% is outstanding, Pre-tax margin of 5% is okay, ROE of 10% is good.
Luxury watch business
The company has a reasonable debt to equity of 12%
Stock retraced and took 50 EMA support
And retraced with low volume
I will look into it once it crosses 1045
Provided Elliot Oscillator turns positive along with stochastic bar on top
