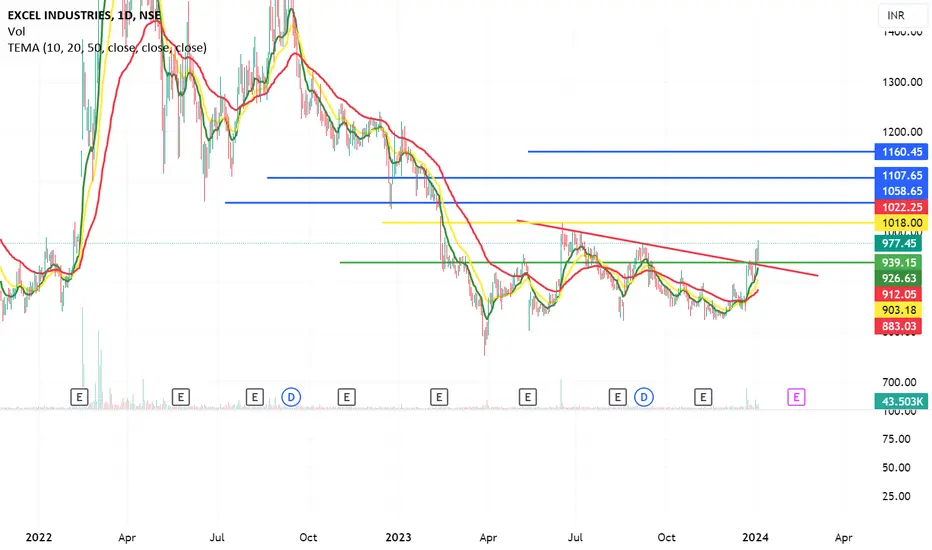
SWING IDEA - EXCEL INDUSTRIESExcel Industries , known for its expertise in manufacturing specialty chemicals, is setting up for a possible swing trade with supporting technicals.
Reasons are listed below :
Breaking out 1600 Zone : The price has tested this level multiple times and is now set to potentially break through, si
67.85 INR
853.13 M INR
9.76 B INR
5.35 M
About EXCEL INDUSTRIES LTD
Sector
Industry
Website
Headquarters
Mumbai
Founded
1941
ISIN
INE369A01029
FIGI
BBG000CR3GJ7
Excel Industries Ltd. engages in the manufacture and sale of chemicals, pharma intermediates and environmental products. It operates through the following segments: Chemicals and Environment. The Chemicals segment comprises of industrial and specialty chemicals, pesticides intermediates, polymer and pharma intermediates. The Environment segment includes soil enricher, bio-pesticides and other bio products. The company was founded by Champraj Chaturbhui Shroff in 1941 and is headquartered in Mumbai, India.
Related stocks

Excel IndustriesLooks Good on weekly Time frame
Target and SL on charts,
* For education and backtesting Purpose only.

EXCELINDUSNSE:EXCELINDUS
Good above 1018
Long term buyer can can on cmp
Rsi >70
chart is showing for fresh upward movement
Excel Industries- Potential to become excellent turnaround storyExcel Industries Ltd. CMP – 902.55
Market Capitalization Rs 1,134.6Cr
Red Flags:🟥
High Valuation (P.E. = 39.8)
Declining annual net profit
FIIs are decreasing stake
Green Flags:🟩
No debt
Zero promoter pledge
Improving cash from operations annual
Dividend Yield @CMP = 1.33%
Happy Candles Number –

Monthly chart excel industries long term support.Excel Industries is in long term support. It is close to 760 level. Can accumulate slowly with a target of next 2,3 year. It will cross it's previous ATH. START with staggered way of 20% now and next 5 tranches.

Excel industries likely ready for a big upmoveAfter long consolidation, a bullish falg formation and closer to major moving averages makes its low risk recomdation for estimated returns of nearly 10-15% in short span. Best suggestive accumulation zone is near 850-60. Can go upto 1057-1194 in next 2qtrs.

EXCEL INDUSTRIES (W)EXCEL INDUSTRIES (W)
- Price has taken support at Reversal zone
- "W" Pattern Formation at support
R1: 1270-1290
#BREAKOUTSTOCKS

EXCELINDUS Swing Trade SetupThis will be my personal trade Setup, This is not an advice of any kind to initiate trade according to this setup. This is for only for my learning purpose and maintaining my trading journal.
Price is in uptrend reversed from Trendline.
Also price broke from box with with volume.
CMP: 982
Nearby

Long setup Excel IndustriesFundamentals are improving with highest quarterly sales. Available at fair value. May reach all time high. Stop loss 1100.
Disclaimer: The stock/index/currency discussed do not constitute Investment/trading advise and is merely an effort towards enhancing learning, knowledge and book keeping. Kindly

Excel industries - Long tradeBullish RSI divergence on daily chart, breakout from last top above 1162. Go long at CMP with a stop loss of 1109. Potential target for this trade is 1300.

See all ideas
Summarizing what the indicators are suggesting.
Oscillators
Neutral
SellBuy
Strong sellStrong buy
Strong sellSellNeutralBuyStrong buy
Oscillators
Neutral
SellBuy
Strong sellStrong buy
Strong sellSellNeutralBuyStrong buy
Summary
Neutral
SellBuy
Strong sellStrong buy
Strong sellSellNeutralBuyStrong buy
Summary
Neutral
SellBuy
Strong sellStrong buy
Strong sellSellNeutralBuyStrong buy
Summary
Neutral
SellBuy
Strong sellStrong buy
Strong sellSellNeutralBuyStrong buy
Moving Averages
Neutral
SellBuy
Strong sellStrong buy
Strong sellSellNeutralBuyStrong buy
Moving Averages
Neutral
SellBuy
Strong sellStrong buy
Strong sellSellNeutralBuyStrong buy
Displays a symbol's price movements over previous years to identify recurring trends.
Frequently Asked Questions
The current price of EXCELINDUS is 1,340.10 INR — it has decreased by −1.19% in the past 24 hours. Watch EXCEL INDUSTRIES LTD stock price performance more closely on the chart.
Depending on the exchange, the stock ticker may vary. For instance, on NSE exchange EXCEL INDUSTRIES LTD stocks are traded under the ticker EXCELINDUS.
EXCELINDUS stock has fallen by −3.24% compared to the previous week, the month change is a 3.57% rise, over the last year EXCEL INDUSTRIES LTD has showed a 3.08% increase.
EXCELINDUS reached its all-time high on Sep 18, 2018 with the price of 1,922.30 INR, and its all-time low was 22.00 INR and was reached on Mar 12, 2009. View more price dynamics on EXCELINDUS chart.
See other stocks reaching their highest and lowest prices.
See other stocks reaching their highest and lowest prices.
EXCELINDUS stock is 4.13% volatile and has beta coefficient of 1.20. Track EXCEL INDUSTRIES LTD stock price on the chart and check out the list of the most volatile stocks — is EXCEL INDUSTRIES LTD there?
Today EXCEL INDUSTRIES LTD has the market capitalization of 16.82 B, it has increased by 1.51% over the last week.
Yes, you can track EXCEL INDUSTRIES LTD financials in yearly and quarterly reports right on TradingView.
EXCELINDUS net income for the last quarter is 124.07 M INR, while the quarter before that showed 62.02 M INR of net income which accounts for 100.04% change. Track more EXCEL INDUSTRIES LTD financial stats to get the full picture.
Yes, EXCELINDUS dividends are paid annually. The last dividend per share was 5.50 INR. As of today, Dividend Yield (TTM)% is 0.41%. Tracking EXCEL INDUSTRIES LTD dividends might help you take more informed decisions.
EXCEL INDUSTRIES LTD dividend yield was 1.42% in 2024, and payout ratio reached 20.26%. The year before the numbers were 0.78% and 40.65% correspondingly. See high-dividend stocks and find more opportunities for your portfolio.
As of Aug 2, 2025, the company has 1.11 K employees. See our rating of the largest employees — is EXCEL INDUSTRIES LTD on this list?
EBITDA measures a company's operating performance, its growth signifies an improvement in the efficiency of a company. EXCEL INDUSTRIES LTD EBITDA is 1.20 B INR, and current EBITDA margin is 12.87%. See more stats in EXCEL INDUSTRIES LTD financial statements.
Like other stocks, EXCELINDUS shares are traded on stock exchanges, e.g. Nasdaq, Nyse, Euronext, and the easiest way to buy them is through an online stock broker. To do this, you need to open an account and follow a broker's procedures, then start trading. You can trade EXCEL INDUSTRIES LTD stock right from TradingView charts — choose your broker and connect to your account.
Investing in stocks requires a comprehensive research: you should carefully study all the available data, e.g. company's financials, related news, and its technical analysis. So EXCEL INDUSTRIES LTD technincal analysis shows the neutral today, and its 1 week rating is buy. Since market conditions are prone to changes, it's worth looking a bit further into the future — according to the 1 month rating EXCEL INDUSTRIES LTD stock shows the buy signal. See more of EXCEL INDUSTRIES LTD technicals for a more comprehensive analysis.
If you're still not sure, try looking for inspiration in our curated watchlists.
If you're still not sure, try looking for inspiration in our curated watchlists.