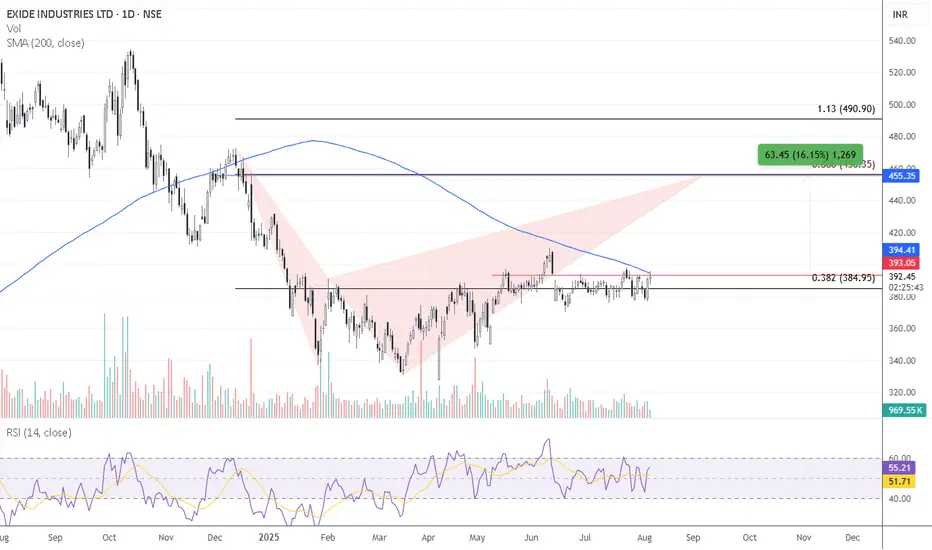
Exide Ltd is currently trading near its 200-day moving averageExide Ltd – Technical Outlook
Exide Ltd is currently trading near its 200-day moving average, which is acting as a key resistance level. A decisive breakout above this level could trigger a positional upmove of approximately 15%, making it a strong candidate for a medium-term long trade.
Additiona
Next report date
—
Report period
—
EPS estimate
—
Revenue estimate
—
10.00 INR
7.95 B INR
171.95 B INR
417.09 M
About EXIDE INDUSTRIES LTD
Sector
Industry
CEO
Avik Kumar Roy
Website
Headquarters
Kolkata
Founded
1946
ISIN
INE302A01020
FIGI
BBG000CPYYY1
Exide Industries Ltd. engages in the provision of manufacturing storage batteries. It operates through the India and Overseas geographical segment. The company was founded in 1946 and is headquartered in Kolkata, India.
Related stocks
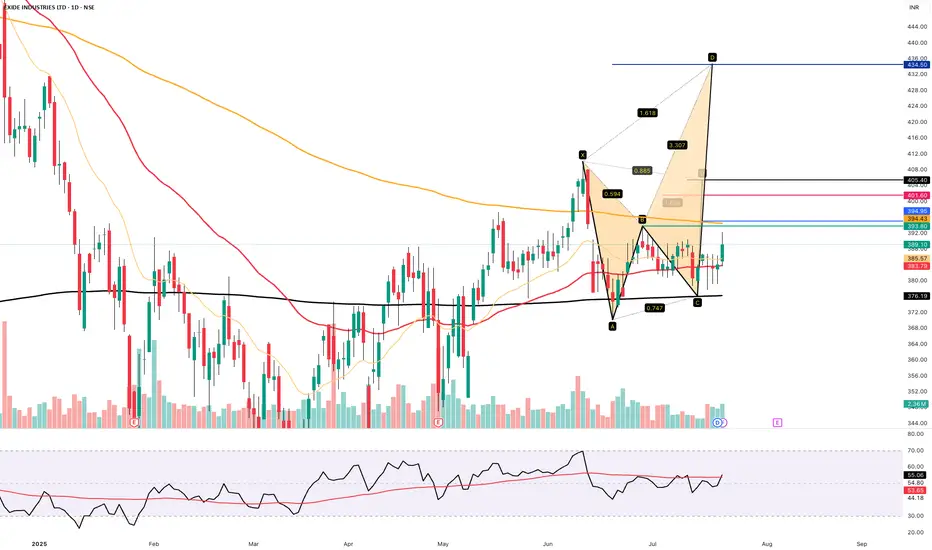
EXIDE INDUSTRIES - ABV 395 ..tgt 405/434++Exide industries ready for big breakout .... abv 394 immediate target 405
Above 405.. 434 and beyond positional
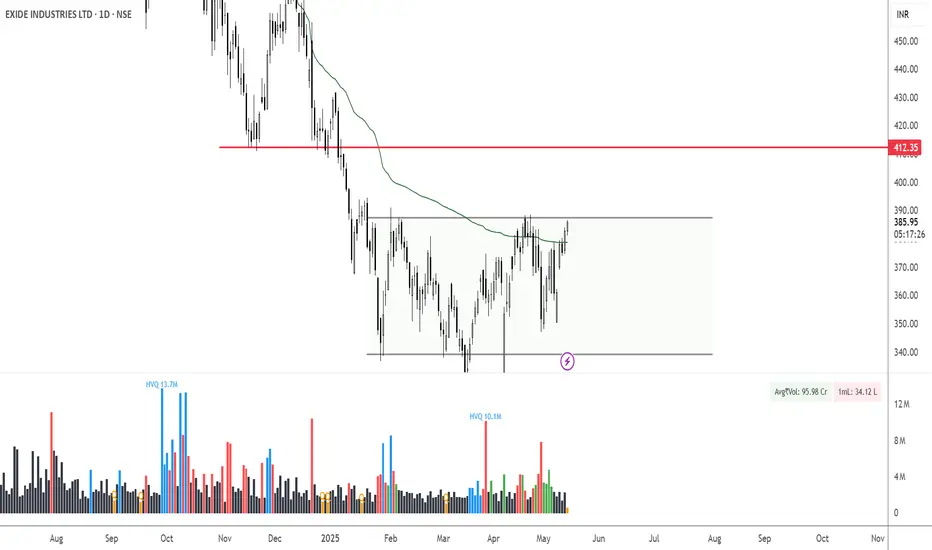
Exide Industries Ready for the Next Bull Run !! Powering Up !!there are two chart of Exide Industries.
In a first chart: EXIDEIND is moving in a well defined parallel channel and currently trading near at support 365-375 range
In the second chart,EXIDEIND is respecting support at both the monthly pivot and the supertrend indicator, with the support zone posi

EXIDEIND Weekly Chart AnalysisEXIDEIND Weekly Chart Analysis – Breakout Brewing?
Published: 7th June 2025
Current Price: ₹393.30 | +0.55% Today
⸻
Key Chart Highlights:
• 1D FVG Zone Cleared: Price has broken out above the fair value gap, hinting at strength
• Downtrend Broken: Price action has closed above descending r

EXIDE INDUSTRIES SWING TRADE SETUP 📊 Price Action & Trend Analysis
Analyzing market trends using price action, key support/resistance levels, and candlestick patterns to identify high-probability trade setups.
Always follow the trend and manage risk wisely!
Price Action Analysis Interprets Market Movements Using Patterns And Trend

Exide Charging Up for a Breakout?RSI Cross + Rounding Base = Bullish Setup! 🔋🚀
🔍 Technical Breakdown
Pattern: Rounding bottom formation after prolonged downtrend.
Momentum Trigger: RSI breakout above 60 indicates fresh buying momentum.
Volume: Steady build-up in volume—accumulation phase might be over.
📈 Trade Setup

Exide Industries xide Industries Ltd is primarily engaged in the manufacturing of storage batteries and allied products in India.
Key Points
Products
The company manufactures batteries for automotive sector like 2 wheeler, 4 wheeler, 3 wheeler, E-rickshaws and H-UPS. It manufactures batteries from 2.5 Ah for 2


Lower low lower highExide industries making Lower low, Lower High. It seems market will go to 150 in up coming weeks. It is a good patter with confirmation of trend

See all ideas
Summarizing what the indicators are suggesting.
Neutral
SellBuy
Strong sellStrong buy
Strong sellSellNeutralBuyStrong buy
Neutral
SellBuy
Strong sellStrong buy
Strong sellSellNeutralBuyStrong buy
Neutral
SellBuy
Strong sellStrong buy
Strong sellSellNeutralBuyStrong buy
An aggregate view of professional's ratings.
Neutral
SellBuy
Strong sellStrong buy
Strong sellSellNeutralBuyStrong buy
Neutral
SellBuy
Strong sellStrong buy
Strong sellSellNeutralBuyStrong buy
Neutral
SellBuy
Strong sellStrong buy
Strong sellSellNeutralBuyStrong buy
Displays a symbol's price movements over previous years to identify recurring trends.
Frequently Asked Questions
The current price of EXIDEIND is 376.20 INR — it has decreased by −0.33% in the past 24 hours. Watch EXIDE INDUSTRIES LTD stock price performance more closely on the chart.
Depending on the exchange, the stock ticker may vary. For instance, on NSE exchange EXIDE INDUSTRIES LTD stocks are traded under the ticker EXIDEIND.
EXIDEIND stock has fallen by −3.82% compared to the previous week, the month change is a −2.75% fall, over the last year EXIDE INDUSTRIES LTD has showed a −24.76% decrease.
We've gathered analysts' opinions on EXIDE INDUSTRIES LTD future price: according to them, EXIDEIND price has a max estimate of 465.00 INR and a min estimate of 300.00 INR. Watch EXIDEIND chart and read a more detailed EXIDE INDUSTRIES LTD stock forecast: see what analysts think of EXIDE INDUSTRIES LTD and suggest that you do with its stocks.
EXIDEIND reached its all-time high on Jun 25, 2024 with the price of 620.35 INR, and its all-time low was 1.90 INR and was reached on Jan 30, 1996. View more price dynamics on EXIDEIND chart.
See other stocks reaching their highest and lowest prices.
See other stocks reaching their highest and lowest prices.
EXIDEIND stock is 0.87% volatile and has beta coefficient of 1.07. Track EXIDE INDUSTRIES LTD stock price on the chart and check out the list of the most volatile stocks — is EXIDE INDUSTRIES LTD there?
Today EXIDE INDUSTRIES LTD has the market capitalization of 320.45 B, it has decreased by −0.18% over the last week.
Yes, you can track EXIDE INDUSTRIES LTD financials in yearly and quarterly reports right on TradingView.
EXIDE INDUSTRIES LTD is going to release the next earnings report on Nov 10, 2025. Keep track of upcoming events with our Earnings Calendar.
EXIDEIND earnings for the last quarter are 3.80 INR per share, whereas the estimation was 3.67 INR resulting in a 3.60% surprise. The estimated earnings for the next quarter are 4.20 INR per share. See more details about EXIDE INDUSTRIES LTD earnings.
EXIDE INDUSTRIES LTD revenue for the last quarter amounts to 45.10 B INR, despite the estimated figure of 45.43 B INR. In the next quarter, revenue is expected to reach 44.81 B INR.
EXIDEIND net income for the last quarter is 2.73 B INR, while the quarter before that showed 1.87 B INR of net income which accounts for 46.09% change. Track more EXIDE INDUSTRIES LTD financial stats to get the full picture.
Yes, EXIDEIND dividends are paid annually. The last dividend per share was 2.00 INR. As of today, Dividend Yield (TTM)% is 0.53%. Tracking EXIDE INDUSTRIES LTD dividends might help you take more informed decisions.
EXIDE INDUSTRIES LTD dividend yield was 0.56% in 2024, and payout ratio reached 21.38%. The year before the numbers were 0.66% and 19.39% correspondingly. See high-dividend stocks and find more opportunities for your portfolio.
As of Aug 13, 2025, the company has 20.69 K employees. See our rating of the largest employees — is EXIDE INDUSTRIES LTD on this list?
EBITDA measures a company's operating performance, its growth signifies an improvement in the efficiency of a company. EXIDE INDUSTRIES LTD EBITDA is 18.63 B INR, and current EBITDA margin is 10.41%. See more stats in EXIDE INDUSTRIES LTD financial statements.
Like other stocks, EXIDEIND shares are traded on stock exchanges, e.g. Nasdaq, Nyse, Euronext, and the easiest way to buy them is through an online stock broker. To do this, you need to open an account and follow a broker's procedures, then start trading. You can trade EXIDE INDUSTRIES LTD stock right from TradingView charts — choose your broker and connect to your account.
Investing in stocks requires a comprehensive research: you should carefully study all the available data, e.g. company's financials, related news, and its technical analysis. So EXIDE INDUSTRIES LTD technincal analysis shows the sell today, and its 1 week rating is sell. Since market conditions are prone to changes, it's worth looking a bit further into the future — according to the 1 month rating EXIDE INDUSTRIES LTD stock shows the neutral signal. See more of EXIDE INDUSTRIES LTD technicals for a more comprehensive analysis.
If you're still not sure, try looking for inspiration in our curated watchlists.
If you're still not sure, try looking for inspiration in our curated watchlists.